Showing posts with label COVID. Show all posts

Thursday, February 06, 2025

From print to perspective: A mixed-method analysis of the convergence and divergence of COVID-19 topics in newspapers and interviews

In previous posts we have noted how one can explore urban issues through newspapers, while at the same time we have used social media to explore trends in vaccinations. In a recently published paper in PLOS Digital Health entitled "From print to perspective: A mixed-method analysis of the convergence and divergence of COVID-19 topics in newspapers and interviews" with Qingqing Chen, Adam Sullivan, Jennifer Surtees, Laurene Tumiel-Berhalter and myself, we thought we would explore how COVID-19 was reported in newspapers and how this varied from interviews. 

The rationale behind this was that the COVID-19 pandemic has led to diverse experiences influenced by public health measures like lockdowns and social distancing. To explore these dynamics, we introduce a novel ’big-thick’ data approach that integrates extensive U.S. newspaper data with detailed interviews. By employing natural language processing (NLP) and geoparsing techniques, we identify key topics related to the pandemic and vaccinations both in newspapers and personal narratives from interviews, and compare the (spatial) convergences and divergences between them. 

We found that both sources converge to highlight the profound impacts of the pandemic on daily life. However, newspapers provide a macro-level perspective, predominately covering policy, public health efforts and economics, while interviews reveal the nuanced impacts at the micro-level, focusing on personal experiences, emotion and concerns. An intriguing finding is the pronounced concern regarding the reliability of news information from interviews. By showcasing both convergences and divergences in identified topics, our study enhances the understanding of key issues that both disseminated to and resonate with the public, contributing to the development of more effective communication strategies for future public health crises.

If this sounds of interest, below you can read the abstract to the paper, see some of the figures which include our workflow and some of the results. At the bottom of the post you can see the full reference and a link to the actual paper. While at https://figshare.com/s/339b1c0d059c189dd6a4?file=44583661 you can find the code we used for our analysis. 

Abstract:

In the face of the unprecedented COVID-19 pandemic, various government-led initiatives and individual actions (e.g., lockdowns, social distancing, and masking) have resulted in diverse pandemic experiences. This study aims to explore these varied experiences to inform more proactive responses for future public health crises. Employing a novel “big-thick” data approach, we analyze and compare key pandemic-related topics that have been disseminated to the public through newspapers with those collected from the public via interviews. Specifically, we utilized 82,533 U.S. newspaper articles from January 2020 to December 2021 and supplemented this “big” dataset with “thick” data from interviews and focus groups for topic modeling. Identified key topics were contextualized, compared and visualized at different scales to reveal areas of convergence and divergence. We found seven key topics from the “big” newspaper dataset, providing a macro-level view that covers public health, policies and economics. Conversely, three divergent topics were derived from the “thick” interview data, offering a micro-level view that focuses more on individuals’ experiences, emotions and concerns. A notable finding is the public’s concern about the reliability of news information, suggesting the need for further investigation on the impacts of mass media in shaping the public’s perception and behavior. Overall, by exploring the convergence and divergence in identified topics, our study offers new insights into the complex impacts of the pandemic and enhances our understanding of key issues both disseminated to and resonating with the public, paving the way for further health communication and policy-making.
An overview of the research workflow.

The monthly distribution of collected articles in the United States from January 2020 to December 2021.

An example of identified entities labeled with predefined entity types.

The spatial distribution of newspaper articles by different scales.


The spatial distribution of identified newspaper topics across different regions in New York State.

Ordered rank of identified topics by percentage from interviews.

Full reference:
Chen, Q., Crooks, A.T., Sullivan, A.J., Surtees, J.A. and Tumiel-Berhalter, L. (2025). From Print to Perspective: A mixed-method analysis of the convergence and divergence of COVID-19 topics in newspapers and interviews, PLOS Digital Health. Available at https://doi.org/10.1371/journal.pdig.0000736. (pdf)

Thursday, October 31, 2024

Studying Contagious Disease Spread: An ABM Framework

In the past we have written about the use of synthetic populations and their use in agent-based models. We are finding such synthetic populations to be extremely useful in the creation or initialization of agent-based models. To give you a sense of how we are utilizing such synthetic populations at the 7th ACM SIGSPATIAL International Workshop on Geospatial Simulation (GeoSim 2024),   Na (Richard) Jiang and myself have a new paper entitled  "Studying Contagious Disease Spread Utilizing Synthetic Populations Inspired by COVID-19: An Agent-based Modeling Framework.

In the paper we show how we can we utilize a method to create the geographically-explicit synthetic population along with capturing their social networks and how this can be used to study  contagious disease spread (and various lineages of the disease) in Western New York. If this sounds of interest, below you can read the abstract from the paper, see some of the results and find the full reference and the link to the paper. While the model itself and the data needed to run it is available at https://osf.io/zrtuj/

Abstract

The COVID-19 pandemic has reshaped societies and brought to the forefront simulation as a tool to explore the spread of the diseases including that of agent-based modeling. Efforts have been made to ground these models on the world around us using synthetic populations that attempt to mimic the population at large. However, we would argue that many of these synthetic populations and therefore the models using them, miss the social connections which were paramount to the spread of the pandemic. Our argument being is that contagious diseases mainly spread through people interacting with each other and therefore the social connections need to be captured. To address this, we create a geographically-explicit synthetic population along with its social network for the Western New York (WNY) Area. This synthetic population is then used to build a framework to explore a hypothetical contagious disease inspired by various of COVID-19. We show simulation results from two scenarios utilizing this framework, which demonstrates the utility of our approach capturing the disease dynamics. As such we show how basic patterns of life along with interactions driven by social networks can lead to the emergence of disease outbreaks and pave the way for researchers to explore the next pandemic utilizing agent-based modeling with geographically explicit social networks.

Keywords: Agent-based Modeling, Synthetic Populations, Social Networks, COVID-19, Disease Modeling.

Single Lineage Results: (a) Overall SEIR Dynamic; (b) Contact Tracing Example.

Western New York Commuting Pattern.

Disease Dynamics when Two Lineages are Introduced.

Reference: 

Jiang N., Crooks, A.T. (2024), Studying Contagious Disease Spread Utilizing Synthetic Populations Inspired by COVID-19: An Agent-based Modeling Framework, Proceedings of the 7th ACM SIGSPATIAL International Workshop on Geospatial Simulation (GeoSim 2024), Atlanta, GA., pp. 29-32. (pdf)

Friday, September 27, 2024

Genomic profiling and spatial SEIR modeling of COVID-19 transmission

Lineage distribution of SARS-CoV-2 across
geographic regions of Ontario, Canada,
Western New York, and New York City over time
In the past we have posted on using agent-based models for explore the spread of diseases. We have been keeping up with this work especially in light of COVID-19. To this end we are excited to introduce our new paper entitled "Genomic Profiling and Spatial SEIR Modeling of COVID-19 Transmission in Western New York" published in Frontiers in Microbiology In this paper have been collaborating with other researchers at the University at Buffalo who focus  on the genomic sequencing of various lineages distribution of SARS-CoV-2. What is special about this  new paper is that we explore how such linages change over space and time and how this relates to movement patterns. If this sounds of interest, below you can read the abstract of the paper, see some the lineages in different regions which change over space and time, and our agent-based model which explores how different lineages might spread though peoples movement patterns. At the bottom of the post, you can see the full reference and the link to the paper itself.  

Abstract: 

The COVID-19 pandemic has prompted an unprecedented global effort to understand and mitigate the spread of the SARS-CoV-2 virus. In this study, we present a comprehensive analysis of COVID-19 in Western New York (WNY), integrating individual patient-level genomic sequencing data with a spatially informed agent-based disease Susceptible-Exposed-Infectious-Recovered (SEIR) computational model. The integration of genomic and spatial data enables a multi-faceted exploration of the factors influencing the transmission patterns of COVID-19, including genetic variations in the viral genomes, population density, and movement dynamics in New York State (NYS). Our genomic analyses provide insights into the genetic heterogeneity of SARS-CoV-2 within a single lineage, at region-specific resolutions, while our population analyses provide models for SARS-CoV-2 lineage transmission. Together, our findings shed light on localized dynamics of the pandemic, revealing potential cross-county transmission networks. This interdisciplinary approach, bridging genomics and spatial modeling, contributes to a more comprehensive understanding of COVID-19 dynamics. The results of this study have implications for future public health strategies, including guiding targeted interventions and resource allocations to control the spread of similar viruses.
Phylogenetic and spatial–temporal distribution of omicron BA.2.12.1. (A) Geographic introduction and organization of BA.2.12.1 lineage from February 2022 to November 2022, by percentage of SARS-CoV-2 circulating in each county per month. N/A represents counties with no BA.2.12.1 cases sequenced. (B) Phylogenetic clustering of jukes-cantor distance estimations between consensus sequences of 2,737 samples. Lineages on the phylogenetic tree are color-coded by county; Erie County (pink), Monroe County (green), Onondaga County (blue), and Westchester County (chartreuse). (C) Hierarchical clustering of sample-to-sample distance estimation of 2,737 BA.2.12.1 lineages in four counties across NYS, with k-means clustering k = 4.
SEIR model schematic and dynamics. (A) Schematics of SEIR model including general parameter and synthetic population parameter sets, and model initialization and function (B) R0 = 3 Susceptibility, Exposed, Infectious, and Recovered curves based on the introduction of two infected agents, monitored over time. (C) R0 = 5, (D) R0 = 8.
Commuter behavior dynamics in WNY. Estimated commuter populations originating in a specific county. (A) Commuter behavior with Erie County origins. (B) Commuter behavior from Niagara County origin. (C) Commuter behavior from Monroe County origin. (D) Composite Commuter behavior network.

Full Reference: 

Bard, J.E., Jiang, N., Emerson, J., Bartz, M., Lamb, N.A., Marzullo, B.J., Pohlman, A., Boccolucci, A., Nowak, N.J., Yergeau, D.A., Crooks, A.T. and Surtees, J. (2024), Genomic Profiling and Spatial SEIR Modeling of COVID-19 Transmission in Western New York, Frontiers in Microbiology, 15. Available at  https://doi.org/10.3389/fmicb.2024.1416580  (pdf)

Friday, June 07, 2024

A comparison of social surveys and social media for vaccine hesitancy

In the past we have explored various ways to explore vaccine hesitancy and keeping with this theme we have a new paper published in PLOS ONE entitled "Understanding the determinants of vaccine hesitancy in the United States: A comparison of social surveys and social media" with Kuleen Sasse, Ron Mahabir, Olga Gkountouna and Arie Croitoru

In the paper we use social, demographic and economic (e.g., US Censusvariables to predict COVID-19 vaccine hesitancy levels in the ten most populous US metropolitan statistical areas (MSAs). By using  machine learning algorithms (e.g., linear regression, random forest regression, and XGBoost regression) we compare a set of baseline models that contain only these variables with models that incorporate survey data and social media (i.e., Twitter) data separately. 

We find that different algorithms perform differently along with variations in influential variables such as age, ethnicity, occupation, and political inclination across the five hesitancy classes (e.g., “definitely get a vaccine”, “probably get a vaccine”, “unsure”, “probably not get a vaccine”, and “definitely not get a vaccine”).   Further, we find that the application of the models to different MSAs yields mixed results, emphasizing the uniqueness of communities and the need for complementary data approaches. But in summary, this paper shows social media data’s potential for understanding vaccine hesitancy, and tailoring interventions to specific communities. If this sounds of interest, below we provide the abstract to the paper along with our mixed methods matrix, data sources used and the results from the various MSAs. At the bottom of the post, you cans see the full reference and the link to the paper so you can read more if you so desire. 

Abstract:
The COVID-19 pandemic prompted governments worldwide to implement a range of containment measures, including mass gathering restrictions, social distancing, and school closures. Despite these efforts, vaccines continue to be the safest and most effective means of combating such viruses. Yet, vaccine hesitancy persists, posing a significant public health concern, particularly with the emergence of new COVID-19 variants. To effectively address this issue, timely data is crucial for understanding the various factors contributing to vaccine hesitancy. While previous research has largely relied on traditional surveys for this information, recent sources of data, such as social media, have gained attention. However, the potential of social media data as a reliable proxy for information on population hesitancy, especially when compared with survey data, remains underexplored. This paper aims to bridge this gap. Our approach uses social, demographic, and economic data to predict vaccine hesitancy levels in the ten most populous US metropolitan areas. We employ machine learning algorithms to compare a set of baseline models that contain only these variables with models that incorporate survey data and social media data separately. Our results show that XGBoost algorithm consistently outperforms Random Forest and Linear Regression, with marginal differences between Random Forest and XGBoost. This was especially the case with models that incorporate survey or social media data, thus highlighting the promise of the latter data as a complementary information source. Results also reveal variations in influential variables across the five hesitancy classes, such as age, ethnicity, occupation, and political inclination. Further, the application of models to different MSAs yields mixed results, emphasizing the uniqueness of communities and the need for complementary data approaches. In summary, this study underscores social media data’s potential for understanding vaccine hesitancy, emphasizes the importance of tailoring interventions to specific communities, and suggests the value of combining different data sources.
Mixed methods matrix showing the data, processing, and model development steps used in our study.

Data sources used in our study.

MSA model performance (Bolded adjusted R2 values represent the best performing model for each modeling technique and MSA).

Monday, May 13, 2024

Using ABM to simulate Covid-19 vaccine uptake

In past blog posts we have discussed how one can use social media to study vaccine discussions and even tried to build a very simple disease model where vaccination rates were a factor in the spread of an outbreak. However, when it comes to vaccinations, especially that of Covid-19 vaccine there has been intense discussions in the physical (e.g., family), hybrid (e.g., work, school) and cyber (e.g., social media) spaces we inhabit. 

One thing that is unclear is how do these discussions in these various hybrid spaces impact our decision to get vaccinated or not? To this end, in a new paper published in the International Journal of Geographical Information Science with Fuzhen Yin, Li Yin and myself, entitled “How information propagation in hybrid spaces affects decision-making: using ABM to simulate Covid-19 vaccine uptake” we explore this. 

More specially we explore how through opinion dynamics modeling, how agents can chose to vaccinate or not and how much emphasis they place on physical, relational and cyber spaces Using Chautauqua County in New York State as a case study our model results captures the temporal dynamics of vaccination progress with small errors but we also find that different age groups demonstrate various preferences for different spaces to receive vaccine related information. 

If this sounds of interest, below you can read the abstract of the paper, see a flow chart of the model logic and some of the results. While at the bottom of the post you can find the full reference and link to the paper. Furthermore, Fuzhen has also provided a detailed Overview, Design Concepts and Details Protocol (ODD) document along with the source code and data needed to run the model at CoMSES Net https://www.comses.net/codebase-release/8967d4ca-9199-4ca8-be49-cab6d14db12c/. 

Abstract 
The notion of physical space has long been central in geographical theories. However, the widespread adoption of information and communication technologies (ICTs) has freed human dynamics from purely physical to also relational and cyber spaces. While researchers increasingly recognize such shifts, rarely have studies examined how the information propagates in these hybrid spaces (i.e., physical, relational, and cyber). By exploring the vaccine opinion dynamics through agent-based modeling, this study is the first that combines all hybrid spaces and explores their distinct impacts on human dynamics from an individual’s perspective. Our model captures the temporal dynamics of vaccination progress with small errors (MAE=2.45). Our results suggest that all hybrid spaces are indispensable in vaccination decision making. However, in our model, most of the agents tend to give more emphasis to the information that is spread in the physical instead of other hybrid spaces. Our study not only sheds light on human dynamics research but also offers a new lens to identifying vaccinated individuals which has long been challenging in disease-spread models. Furthermore, our study also provides responses for practitioners to develop vaccination outreach policies and plan for future outbreaks. 

Keywords: Agent-based modeling, hybrid space, opinion dynamics, Covid-19, vaccination. 


Flowchart of the modeling process. 

Comparing predicted and observed vaccination rates of all populations by giving physical, relational, cyber spaces different weights. Mean absolute error (MAE) and root mean square error (RMSE) are reported to evaluate the quality of predictions.

Comparing predicted and observed vaccination rates among different age groups by using the weight combination 3 (physical), 1 (relational), 1 (cyber) for hybrid spaces. 

Comparing predicted and observed vaccination rates by varying weights of hybrid spaces for different age groups.

Spatial distribution of Covid-19 vaccines. (a)-(d) Point density of vaccination allocation at different time steps. (e) Predicted vaccination rates at census block group level.

Full Referece:
Yin, F., Crooks, A.T. and Yin, L. (2024), How information propagation in hybrid spaces affects decision-making: using ABM to simulate Covid-19 vaccine uptake, International Journal of Geographical Information Science, https://doi.org/10.1080/13658816.2024.2333930 (pdf)
Wednesday, June 28, 2023

Editorial: Urban analytical approaches to combating the Covid-19 pandemic

While there has been a lot written about COVID-19 Angela  Yao, Bin Jiang, Jukka Krisp, Xintao Liu, and Haosheng Huang and myself have just recently wrapped up a special issue in Environment and Planning B and how it can be studied through the lens of urban analytics.  After a call for papers for the special issue, we published 10 papers that cover a wide spectrum of analytical methods have been used to study the pandemic. These ranged from how policies impacted pedestrian patterns to how data could on the disease could be visualized along with many things in between. Below you can see papers:

Accompanying these papers is an editorial entitled "An overview of urban analytical approaches to combating the Covid-19 pandemic," In this editorial we situate these papers in the larger literature of urban analytics and Covid-19. Also in the editorial, we explore what can be learned from the current research on Covid-19 and finally we identify gaps and future research opportunities for urban analytics in combating epidemic outbreaks.

A framework of the Covid-19 pandemic dynamics in urban systems.


Covid-19 research themes and topics through the lens of geography and urban analytics.

Full Reference:

Yao, X.A, Crooks, A.T., Jiang, B., Krisp, J., Liu, X. and Huang, H. (2023), An overview of urban analytical approaches to combating the Covid-19 pandemic, Environment and Planning B, 50 (5), pp. 1133–1143. (pdf)


Saturday, May 20, 2023

Simulation & Optimization Techniques for the Mitigation of Disruptions to Supply Chains

Our last paper at the Annual Modeling and Simulation Conference (ANNSIM) is entitled "Simulation and Optimization Techniques for the Mitigation of Disruptions to Supply Chains" where we (Raj Patel, Abhisekh Rana, Sean Luke, Carlotta Domeniconi, Hamdi Kavak, Jim Jones and myself) build upon our previous work which explored how the actions of criminal networks and agents might impact supply chains. 
 
This paper extends this research to incorporate both disruption and mitigation modeling into the same simulation.  By using evolutionary computation optimization techniques (e.g., Covariance Matrix Adaptation Evolution Strategy) we demonstrate how we can optimize both the disruption and mitigation scenarios in a pharmaceutical supply chain (which we call PharmaSIM). Our results demonstrate how  evolutionary computation techniques could be used to not only identify worst-case disruption scenarios but to also optimize the allocation of the mitigations to counter their effects.  If this sounds of interest, below we provide the abstract to the paper, some of the figures we use to support our discussion and results. While at the bottom of the post we provide the full reference to the paper along with a link to a preprint of it. 

Abstract
The COVID-19 pandemic has clearly highlighted the importance of supply chains to the function of the world economy. Moreover, the global nature of most modern supply chains along with their complexity has left them vulnerable to a wide-ranging set of disruptive scenarios. This increase in complexity has also led to a corresponding increase in disruptions to supply chains from criminal networks. In this paper, we demonstrate how a generic pharmaceutical supply chain network can be successfully modeled using discrete event simulation. We outline how disruptions by criminal networks and mitigation strategies to counter them can be effectively incorporated into the same model. Finally, we show how optimization techniques, such as evolutionary computation, can be used to not only identify worst-case disruptions and find mitigations for them, but also be used to identify mitigation strategies that are effective against a diverse set of damaging disruption scenarios.

Keywords: Simulation, Optimization, Supply Chains, Disruptions, Mitigation. 


Topology of the generic pharmaceutical supply chain (PharmaSIM) model.

Fitness after evolutionary optimization of attack configurations and corresponding safety stock allocation for different budgets.

Fitness by generation for the coevolution of attack vectors and mitigation configurations.

Full Reference:

Rana, R., Patel, R., Luke, S., Domeniconi, C., Kavak, H., Jones, J. and Crooks, A.T.  (2023), Simulation And Optimization Techniques for the Mitigation of Disruptions to Supply Chains, The Annual Modeling and Simulation Conference (ANNSIM), Hamilton, ON. (pdf)

Thursday, February 09, 2023

Comparison between Online Social Media Discussions and Vaccination Rates

Continuing our work on social media and vaccinationsQingqing Chen, Arie Croitoru, and myself have a new paper entitled "A comparison between online social media discussions and vaccination rates: A tale of four vaccines" published in DIGITAL HEALTH. In the paper we explore online debates among four prominent vaccines (i.e., COVID-19, Influenza, MMR, and HPV) as captured on Twitter in the United States (US) from 2015 to 2021.

By using machine learning models (e.g., Naive Bayes, support vector machine (SVM), logistic regression, and extreme gradient boosting (XGBoost)) on over  11.7 million Twitter messages sent by approximately 2.6 million distinct users we found that while the COVID-19, it has come to dominate the vaccination discussion, there was an apparent discrepancy between the online debates and the actual vaccination rates in the US. 

If this sounds of interest and you wish to find out more, below we provide the abstract to to the paper, some figures which captures our workflow and a sample of the results such as a comparison between different vaccine discussions on Twitter and the actual vaccination rate. Finally at the bottom of the page you can find the full reference and a link to the paper.

Abstract

The recent COVID-19 pandemic has brought the debate around vaccinations to the forefront of public discussion. In this discussion, various social media platforms have a key role. While this has long been recognized, the way by which the public assigns attention to such topics remains largely unknown. Furthermore, the question of whether there is a discrepancy between people's opinions as expressed online and their actual decision to vaccinate remains open. To shed light on this issue, in this paper we examine the dynamics of online debates among four prominent vaccines (i.e., COVID-19, Influenza, MMR, and HPV) through the lens of public attention as captured on Twitter in the United States from 2015 to 2021. We then compare this to actual vaccination rates from governmental reports, which we argue serve as a proxy for real-world vaccination behaviors. Our results demonstrate that since the outbreak of COVID-19, it has come to dominate the vaccination discussion, which has led to a redistribution of attention from the other three vaccination themes. The results also show an apparent discrepancy between the online debates and the actual vaccination rates. These findings are in line with existing theories, that of agenda-setting and zero-sum theory. Furthermore, our approach could be extended to assess the public's attention toward other health-related issues, and provide a basis for quantifying the effectiveness of health promotion policies.

Keywords:  COVID-19, Influenza, MMR, HPV, Social media, Vaccination.


The workflow for comparing between online social media discussion and vaccination rates.

The quarterly distribution of percentage of users by different vaccine discussion from 2015 to 2021.

 The comparison between different vaccine discussions on Twitter and growth rate of the actual vaccination rate collected from the CDC (a) COVID-19; (b) Influenza; (c) HPV; (d) MMR.

The changes of emotion over time for different vaccines.

Full reference: 

Chen Q, Croitoru A. and Crooks A.T (2023), A Comparison between Online Social Media Discussions and Vaccination Rates: A tale of four vaccines. DIGITAL HEALTH: 9. doi:10.1177/20552076231155682. (pdf)

Tuesday, May 10, 2022

Analyzing the vaccination debate in social media data Pre- and Post-COVID-19 pandemic

In the past we have written about how vaccination is discussed on social media but such studies were often just focused on short study periods (i.e. a month). However, with the current COVID-19 pandemic we thought we would revisit the vaccination  debate and see if it has changed. So in a new paper with Qingqing Chen entitled "Analyzing the vaccination debate in social media data Pre- and Post-COVID-19 pandemic," we did just that. We explored approximately 11.7 million tweets posted between January 2015 to July 2021 and measured and mapped vaccine sentiments (Pro-vaccine, Anti-vaccine, and Neutral) across the US. Not to ruin the surprise of what we found but also to encourage you to read the paper we will not write about the results here. Only show the abstract of the paper, a few of the figures and a link to the paper itself.

Abstract

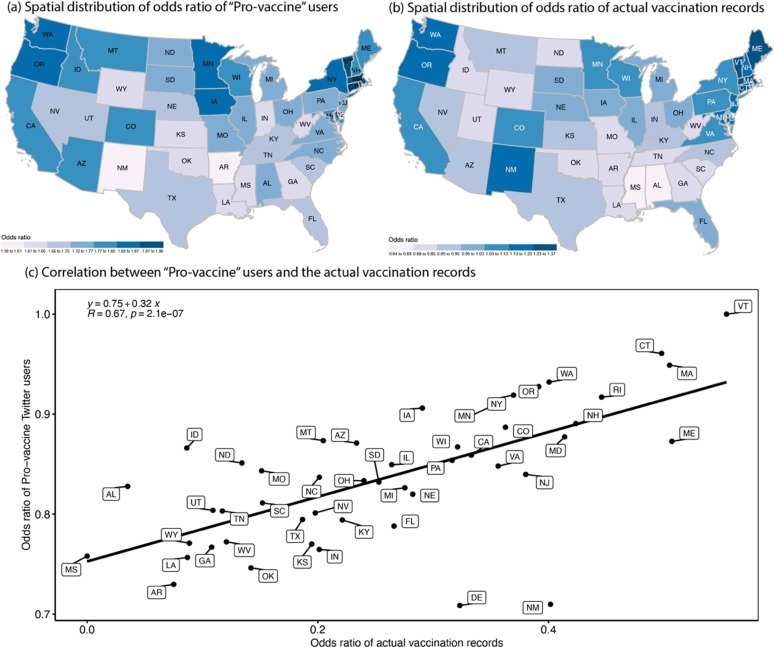
The COVID-19 virus has caused and continues to cause unprecedented impacts on the life trajectories of millions of people globally. Recently, to combat the transmission of the virus, vaccination campaigns around the world have become prevalent. However, while many see such campaigns as positive (e.g., protecting lives), others see them as negative (e.g., the side effects that are not fully understood scientifically), resulting in diverse sentiments towards vaccination campaigns. In addition, the diverse sentiments have seldom been systematically quantified let alone their dynamic changes over space and time. To shed light on this issue, we propose an approach to analyze vaccine sentiments in space and time by using supervised machine learning combined with word embedding techniques. Taking the United States as a test case, we utilize a Twitter dataset (approximately 11.7 million tweets) from January 2015 to July 2021 and measure and map vaccine sentiments (Pro-vaccine, Anti-vaccine, and Neutral) across the nation. In doing so, we can capture the heterogeneous public opinions within social media discussions regarding vaccination among states. Results show how positive sentiment in social media has a strong correlation with the actual vaccinated population. Furthermore, we introduce a simple ratio between Anti and Pro-vaccine as a proxy to quantify vaccine hesitancy and show how our results align with other traditional survey approaches. The proposed approach illustrates the potential to monitor the dynamics of vaccine opinion distribution online, which we hope, can be helpful to explain vaccination rates for the ongoing COVID-19 pandemic.

Keywords: COVID-19, Pandemic, Vaccination Sentiment Analysis, Time and Space, Social Media, United States.

Overview of our research pipeline.

Comparison between Twitter data and Google Trends. (a) Distribution of keywords search and tweets over time; (b) Correlation between Google Trends and Twitter data of keywords search; (c) Important news or announcements catched on Twitter activity (Note: period is the shaded area in (a)).

Correlation between Pro-vaccine users and actual vaccination records (a) Spatial distribution of odds ratio of Pro-vaccine users; (b) Spatial distribution of odds ratio of actual vaccination records; (c) Correlation between the Pro-vaccine users and the actual vaccination records.

Full Reference: 

Chen, Q. and Crooks, A.T. (2022), Analyzing the Vaccination Debate in Social Media Data Pre- and Post-COVID-19 Pandemic, International Journal of Applied Earth Observation and Geoinformation, 110: 102783.  Available at https://doi.org/10.1016/j.jag.2022.102783 (pdf)


Tuesday, November 16, 2021

Delineating a ‘15-Minute City’: An Agent-based Modeling Approach

With more and more people living in urban areas and the current COVID pandemic, human mobility within cities has changed. With this change there is a a growing debate about what it would take to make cities more accessible.  For example, what would it take for the inhabitants of cities be able to access most of their daily essentials (e.g., shopping, work, education, entertainment) within 15 minutes, commuting from their own doorstep either via walking, cycling, or other modes of transportation (e.g., bus, rail)?

To explore this notion of a 15 minute city, at the GeoSim'21: the 4th ACM SIGSPATIAL International Workshop on GeoSpatial Simulation, Qingqing Chen  and myself had a paper entitled "Delineating a ‘15-Minute City’: An Agent-based Modeling Approach to Estimate the Size of Local Communities." While below we provide the abstract to the paper, being an online workshop, the talks were recorded so if you don't want to read the paper, you can watch Qingqing introduce the paper and see an example model run below. If this is of interest, at the bottom of the post we provide a link to the paper, while the actual model along with data needed to run the model can be found at https://github.com/chenqingqing/delineating-a-15minsCity.  

Abstract:

With progressively increased people living in cities, and lately the global COVID-19 outbreak, human mobility within cities has changed. Coinciding with this change, is the recent uptake of the ‘15-Minute City’ idea in urban planning around the world. One of the hallmarks of this idea is to create a high quality of life within a city via an acceptable travel distance (i.e., 15 minutes). However, a definitive benchmark for defining a ‘15- Minute City’ has yet to be agreed upon due to the heterogeneous character of urban morphologies worldwide. To shed light on this issue, we develop an agent-based model named ‘D-FMCities’ utilizing realistic street networks and points-of-interest, in this instance the borough of Queens in New York City as a test case. Through our modeling we grow diverse communities from the bottom up and estimate the size of such local communities to delineate 15-minute cities. Our findings suggest that the model could be helpful to detect the flexibility of defining the extent of a ‘15-minute city’ and consequently support uncovering the underlying factors that may affect its various definitions and diverse sizes throughout the world. 

Keywords: 15-minute city, Agent-based modelling, Local communities, Street networks, Point-of-interests, COVID-19.

Model Demo:

Full Reference:

Chen, Q and Crooks, A.T. (2021). Delineating a ‘15-Minute City’: An Agent-based Modeling Approach to Estimate the Size of Local Communities. In GeoSim '21: Proceedings of the 4th ACM SIGSPATIAL International Workshop on GeoSpatial Simulation, November 2, 2021, Beijing, China, pp 29-37.  (PDF)


Thursday, October 15, 2020

The Impact of Mandatory Remote Work during the COVID-19 Pandemic

In the past we have written about using agent-based modeling to study human resources management issues and how workplace the layout might impact subordinates interactions with managers but with growing amounts data we can explore how employees communicate with each other. To this end, Talha Oz and myself have a  new paper entitled "Exploring the Impact of Mandatory Remote Workduring the COVID-19 Pandemic" which will be presented in a special session on COVID-19 at the 2020 International Conference on Social Computing, Behavioral-Cultural Modeling, & Prediction and Behavior Representation in Modeling and Simulation (or SBP-Brims 2020 for short). 

In this study we exploit metadata (and not content) emitted from commonplace workplace technologies such as calendar and workplace messaging apps collected from a tech company in order to see how mandatory remote work changed communication patterns and how such data can be used to measure organizational health. If this is of interest to you, below we provide the abstract to the paper along with some of the results with respect to how meetings and communication patterns changed from  business as usual (BAU), pre pandemic to that when people were forced to work from home (WFH). Finally at the bottom of the post we provide the full reference and the link to the paper.

Abstract. During the early months of the COVID-19 pandemic, millions of people had to work from home. We examine the ways in which COVID-19 affect organizational communication by analyzing five months of calendar and messaging metadata from a technology company. We found that: (i) cross-level communication increased more than that of same-level, (ii) while within-team messaging increased considerably, meetings stayed the same, (iii) off-hours messaging became much more frequent, and that this effect was stronger for women; (iv) employees respond to non-managers faster than managers; finally, (v) the number of short meetings increased while long meetings decreased. These findings contribute to theories on organizational communication, remote work, management, and flexibility stigma. Besides, this study exemplifies a strategy to measure organizational health using an objective (not self-report based) method. To the best of our knowledge, this is the first study using workplace communication metadata to examine the heterogeneous effects of mandatory remote work. 

Keywords: Work from Home, Communication, COVID-19, Organization.


Full Reference:

Oz, T. and Crooks, A.T. (2020), Exploring the Impact of Mandatory Remote Work during the COVID-19 Pandemic, 2020 International Conference on Social Computing, Behavioral-Cultural Modeling and Prediction and Behavior Representation in Modeling and Simulation, Washington DC. (pdf)

 If you would like a pre-print of  paper, just let us know and we can email you one.