Thursday, December 08, 2022

Simulating Geographical Systems using CA and ABMs

 
In the chapter we discuss how thinking and studying of geographical systems like cities has changed over time from top down aggregate analysis to more bottom up approaches which captures the complex nature of such systems. We then discuss how we can model such systems from a cellular automata and agent-based perspectives. and how these styles of models have evolved and how they can be used to model future systems. If this sounds of interest below we provide the abstract to the chapter, some of the figures that accompany it and at the  bottom of the page we provide the full reference to the paper along with a link to the chapter itself.
"Abstract: How we view and understand the processes driving and shaping geographical systems is constantly evolving. This is due to the appearance of new rich data sources, increased computing power and storage, and the development of individual-level approaches. This allows us to explore geographical systems (from the bottom up) at scales not possible in the past. In this chapter, we examine the utility of two of the most commonly used individual-level modelling approaches, cellular automata and agent-based modelling. We outline their key differences and how these models are being used to further our understanding of geographical systems through simulation. We conclude with a discussion about the challenges that both approaches need to meet to continue developing into the future.
Keywords: Cellular automata; Agent-based models; Geographical systems; Machine learning
 

A SLEUTH like model stylized on Santa Fe, New Mexico denoting how land use charges over time from undeveloped (grey) to urban (red).

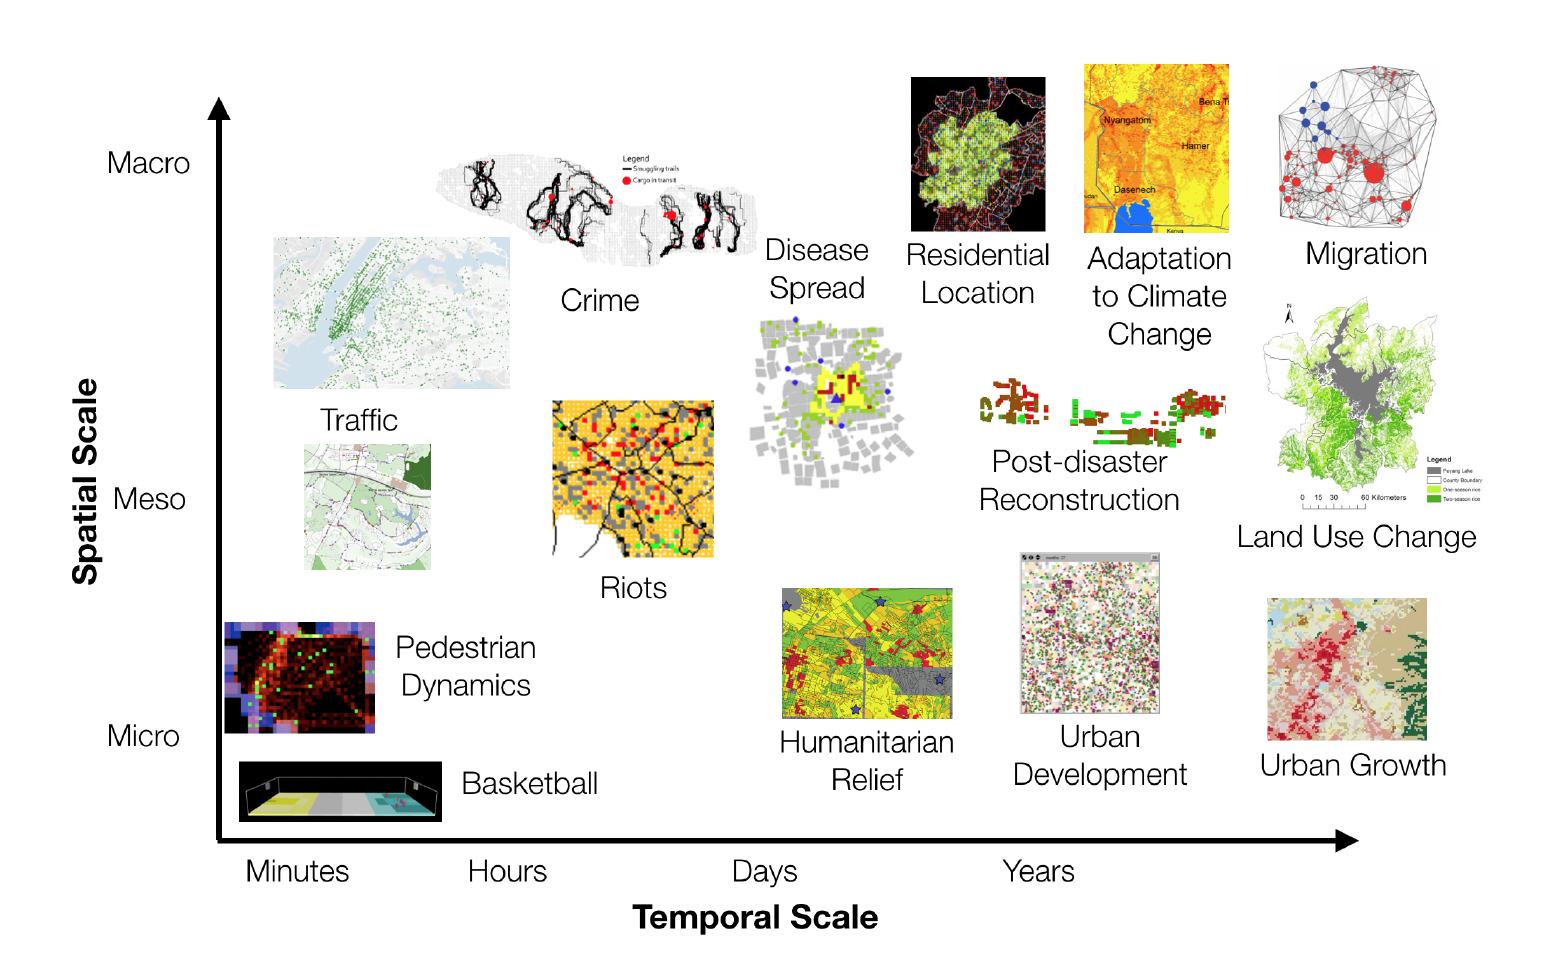
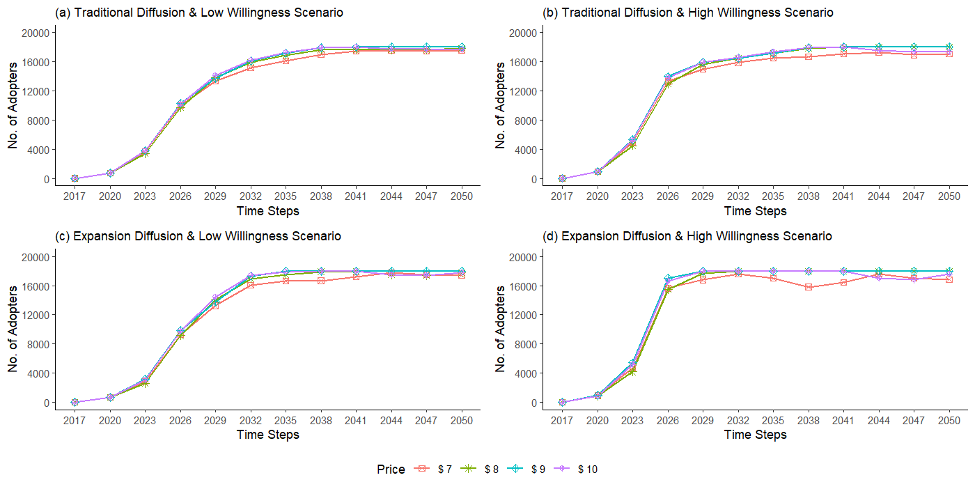
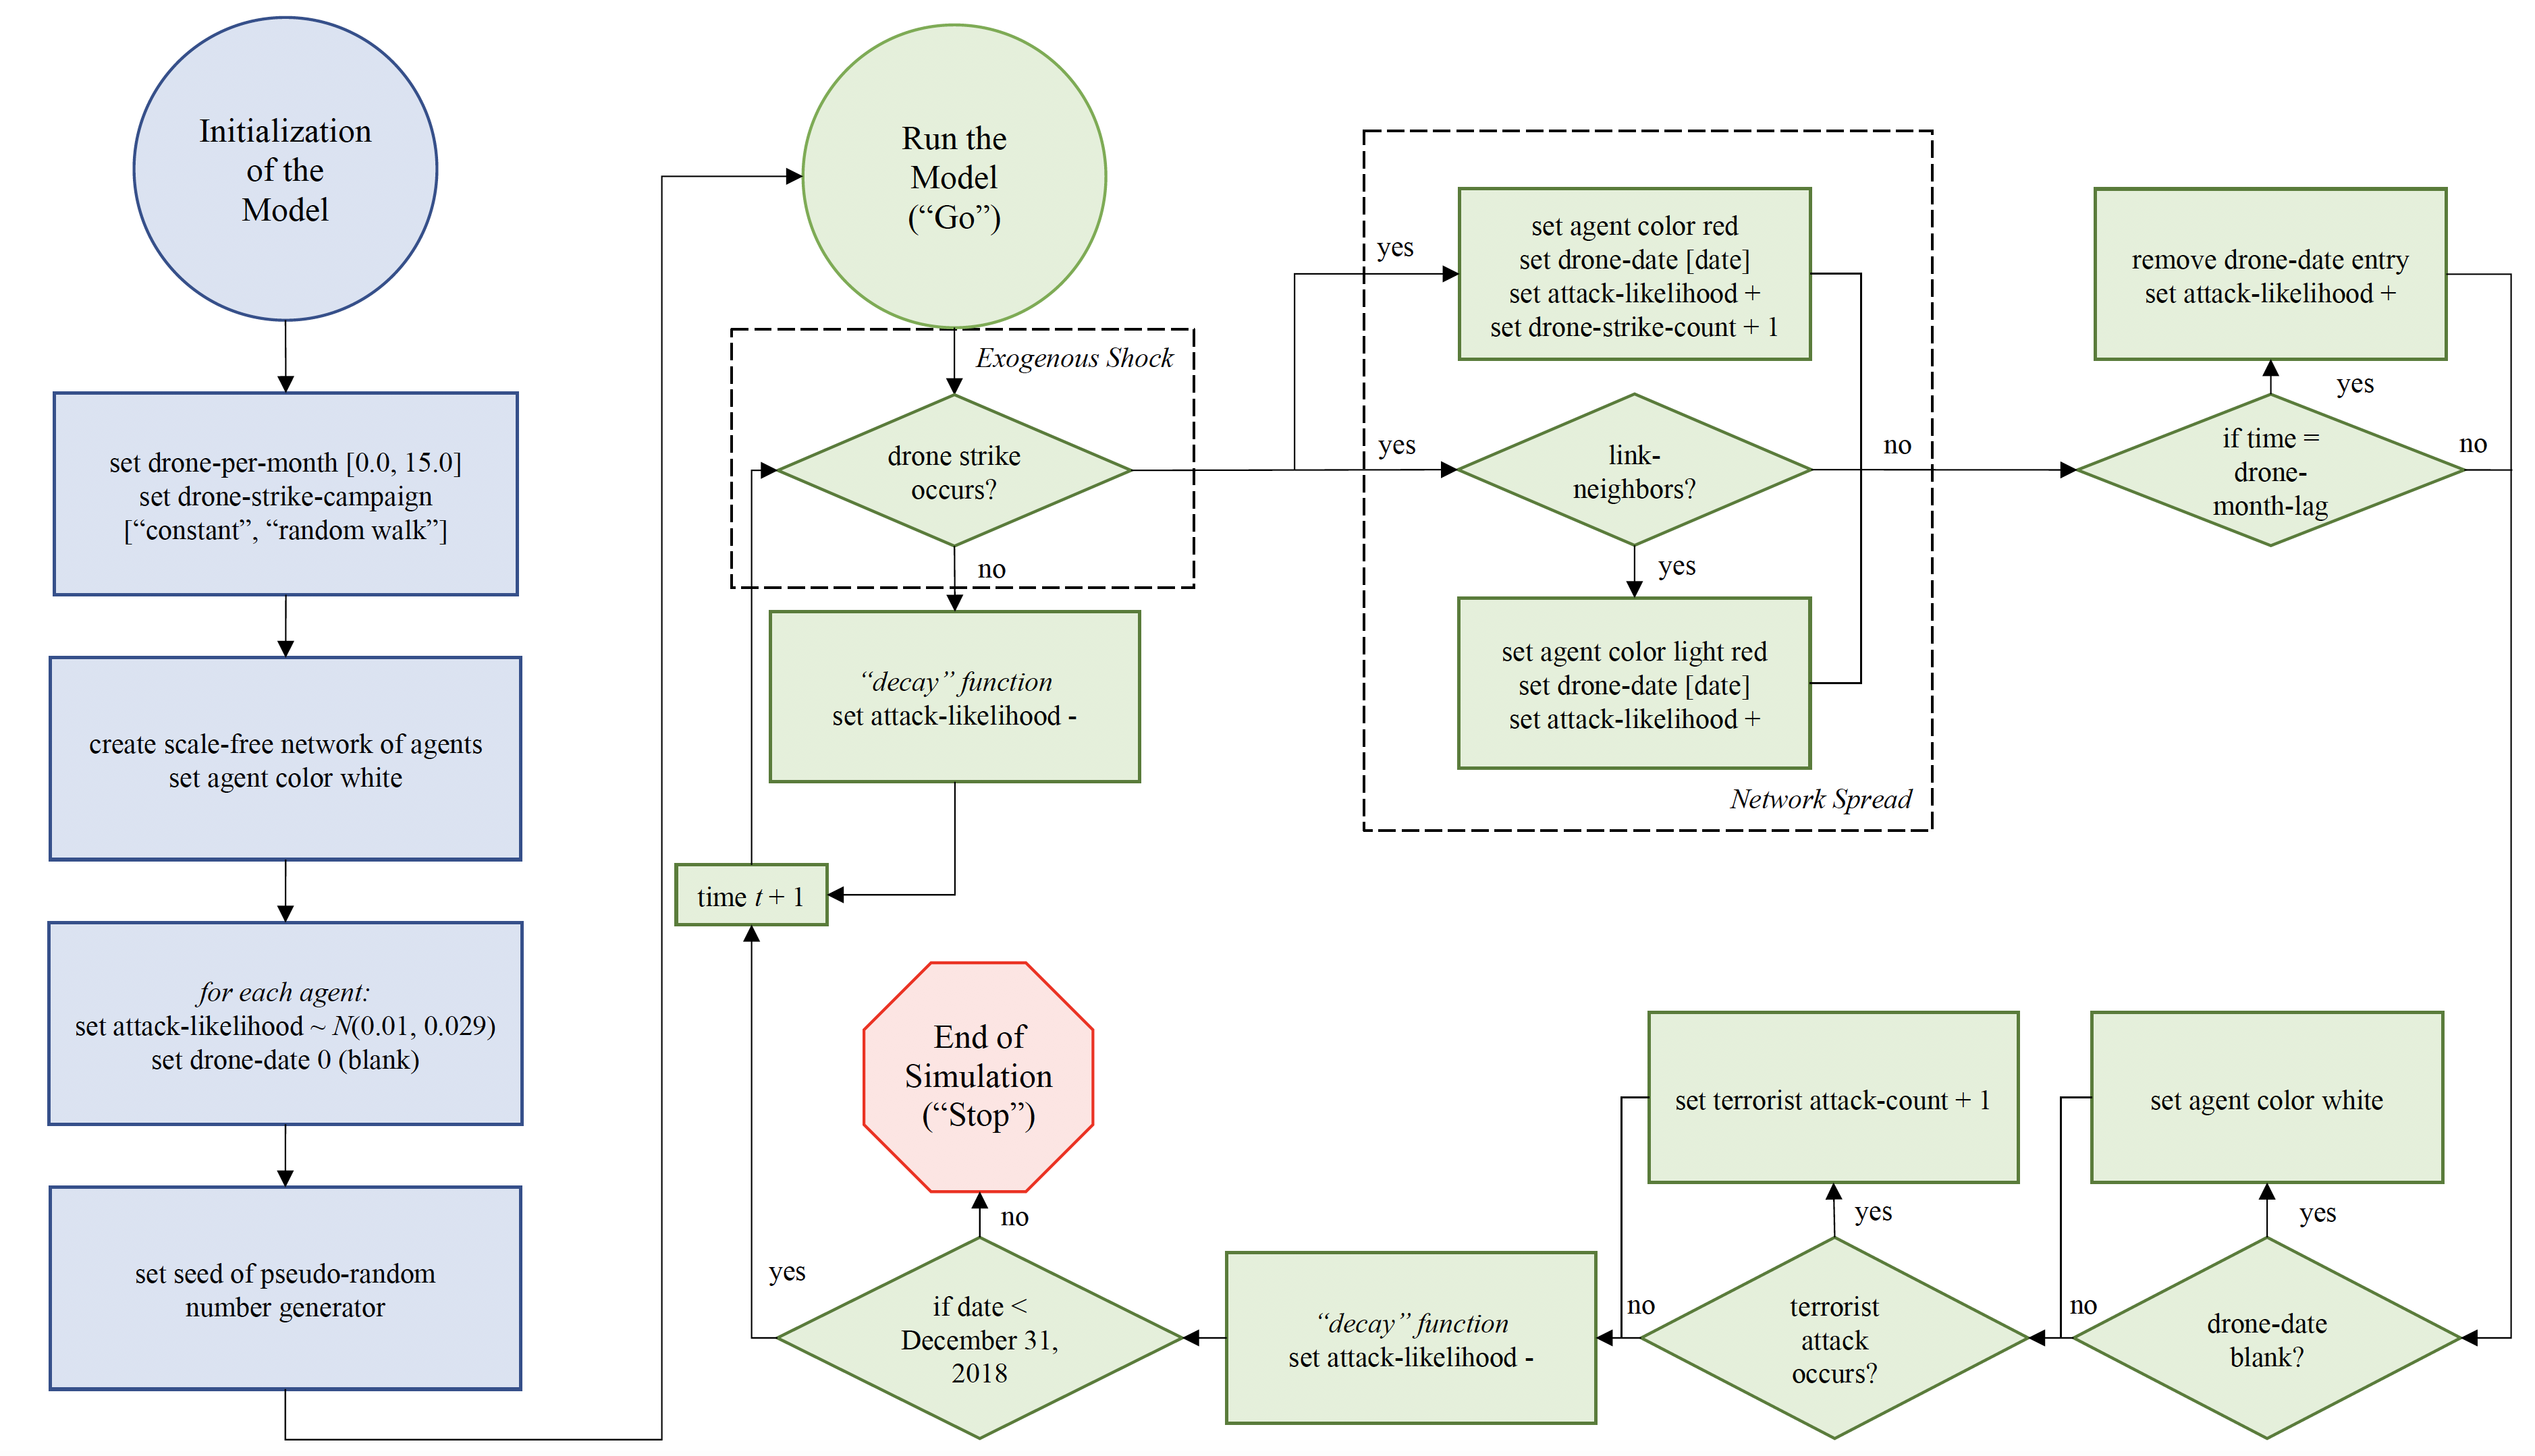
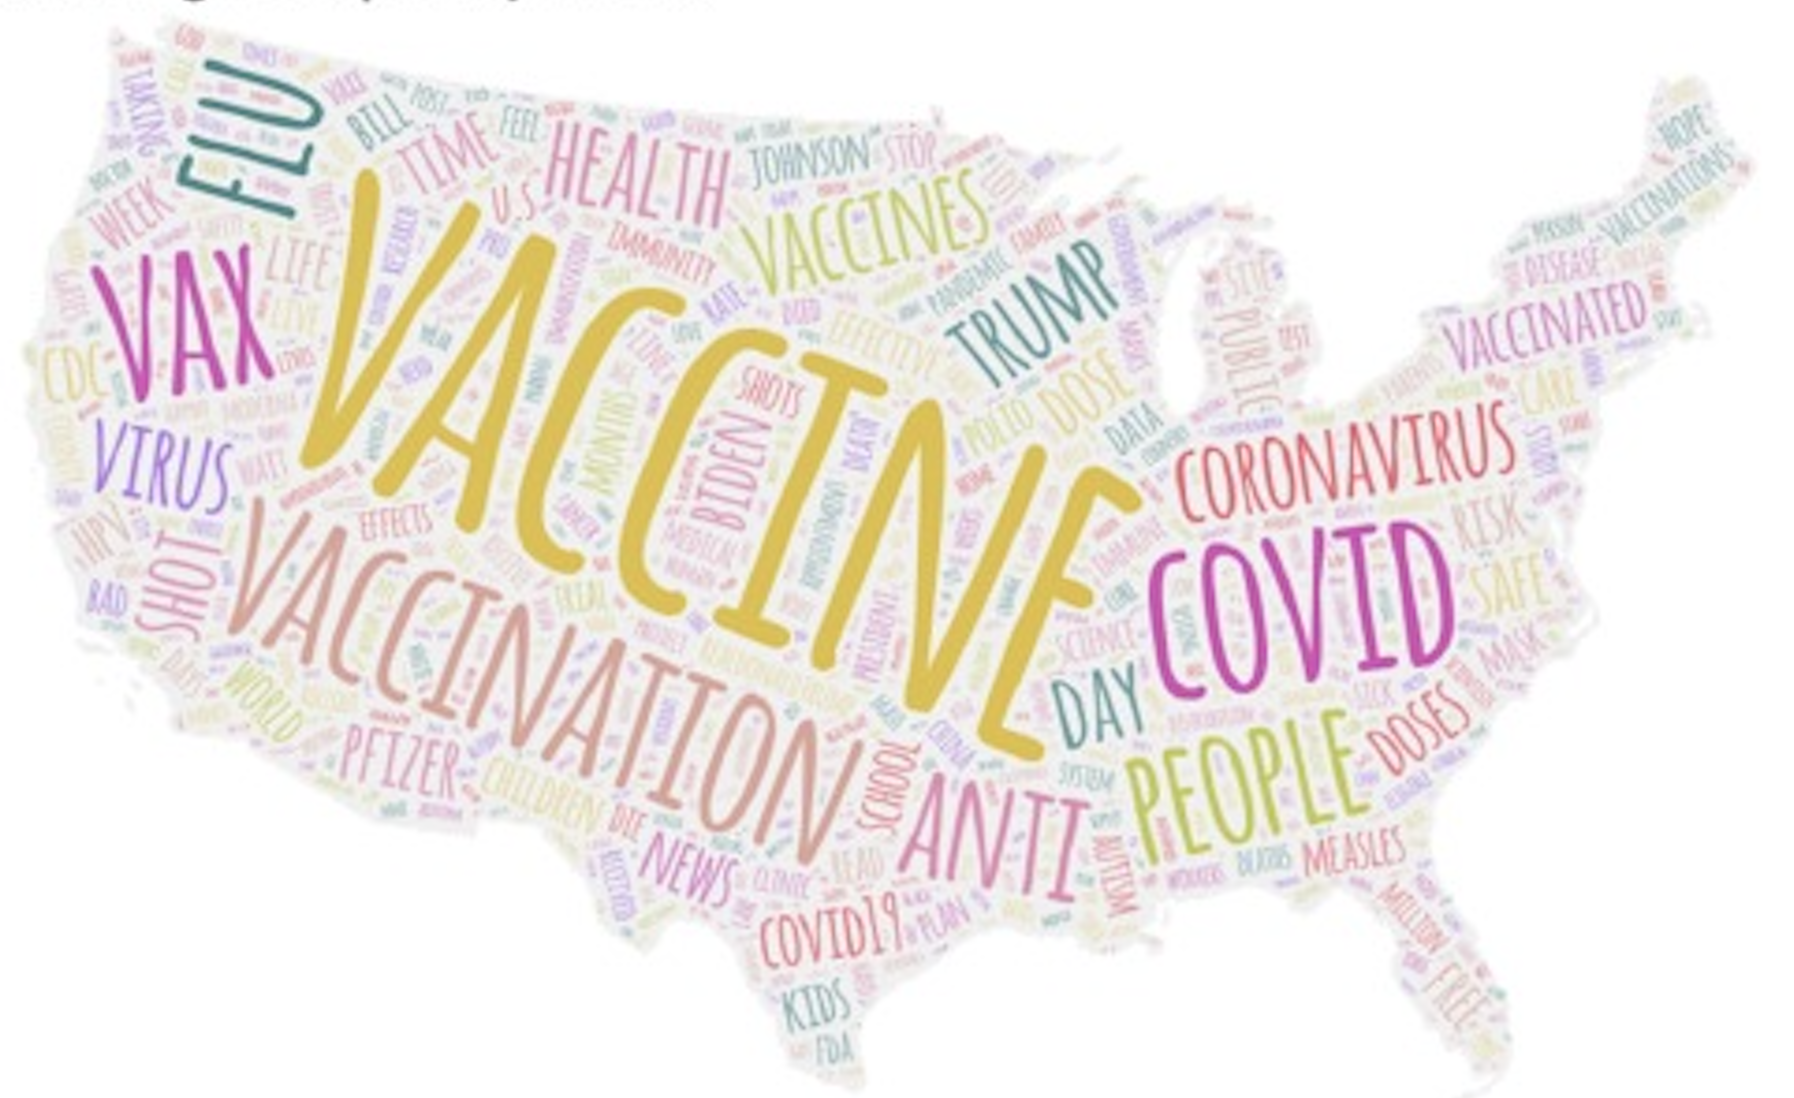
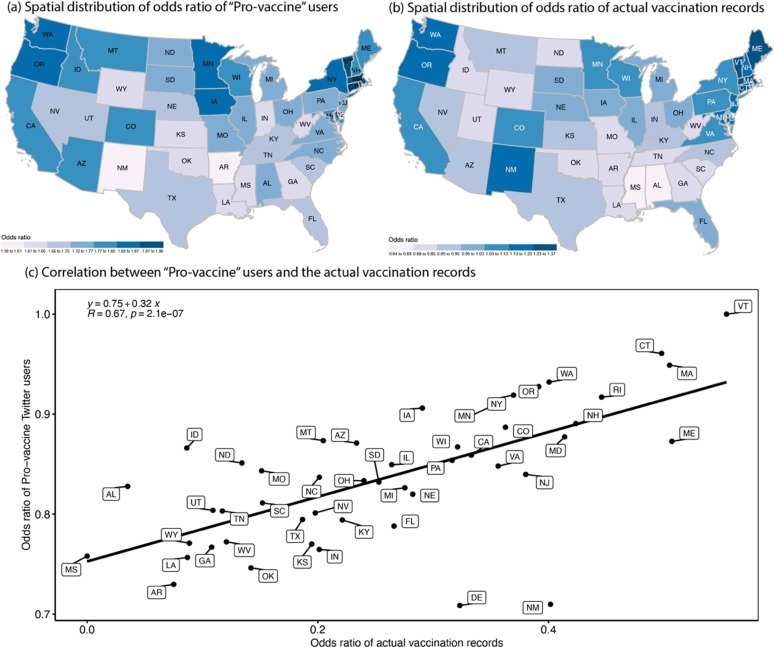
Example applications of agent-based models at different spatial and temporal scales

Full reference:

Heppenstall, A., Crooks, A.T., Manley, E. and Malleson, N. (2022) Simulating Geographical Systems using Cellular Automata and Agent-based Models, in Rey S. and Franklin, R. (eds.), Handbook of Spatial Analysis in the Social Sciences, Edward Elgar Publishing, Cheltenham, UK, pp. 142-157. (pdf)

Friday, November 11, 2022

Announcing MASON 21, Geomason 1.7 & Distributed MASON 1

Many visitors and readers to this site know that for a long time I have been involved with and developing agent-based models utilizing MASON. To this end, the other day Sean Luke posted a message to the MASON list-serve regarding new releases of MASON, GeoMASON  and the first release of Distributed MASON which is part of our NSF CI-EN: Enhancement of a Large-scale Multiagent Simulation Tool project

To quote from the email:

"MASON is a high performance open-source modeling toolkit in pure Java, designed to be fast, highly hackable and modifiable, and to guarantee repeatable results, among many other capabilities. MASON comes with extensive visualization capabilities and regularly runs on everything from laptops to back-end supercomputers".

"Distributed MASON is an open-source, massively distributed version of MASON meant for server/farm and cloud computing deployment using a combination of MPI and RMI. It runs MASON over a large number of collective machines. "

"GeoMASON is an open source set of extensions to MASON which add GIS capabilities, including reading and writing standard formats, embodying agents in GIS environments, and visualization."

"Distributed GeoMASON is an open source set of extensions to GeoMASON to enable it to run over Distributed MASON in both server/farm and cloud computing environments."

For those interested in GIS and agent-based models, we have added many more application examples (a sample of which is shown below), along with fixing a number of bugs, and adding new code for compatibility with Distributed MASON. For more details check out the MASON webpage: http://cs.gmu.edu/~eclab/projects/mason/.

Examples of some of the GeoMason Models

If you have questions regarding MASON, GeoMason, or their distributed versions, join the MASON mailing list and ask


Tuesday, November 01, 2022

Mesa-Geo: ABM and GIS in Python (A Update)

A couple of months ago we had a post about Mesa-Geo but only a short one. Now we want to go into more detail as we (Boyu Wang, Vincent Hess and myself) just presented a paper about it at the 5th ACM SIGSPATIAL International Workshop on Geospatial Simulation (GeoSim 2022). The paper itself was entitled "Mesa-Geo: A GIS Extension for the Mesa Agent-Based Modeling Framework in Python" in which we discuss in detail the need for a python library for creating geographically explicit agents (or GeoAgents) and introduce its architecture. 

In the paper we detail how we have designed Mesa-Geo to handle spatial data (both in terms of raster and vector via GeoSpace), how we have enabled visualization of geographical data and such models along with creating features to export geographical data from the simulations (using Rasterio and GeoPandas). To support this discussion we also provide some explicit examples on how the pieces fit together  range from rainfall flowing over a digital terrain model (DEM) to Schelling types of models using points and polygons as agents, to that of agents using road networks to navigate over an area. Boyu has also put together more details about the examples at: https://mesa-geo.readthedocs.io/en/latest/examples/overview.html (which includes movies of them running).  The actual code for the models and Mesa-Geo can be found at https://github.com/projectmesa/mesa-geo. Just to give you a sense of the paper and what Mesa-Geo can do, below we provide the abstract to the paper, some figures showing the architecture, along with some example applications. While at the bottom of the post you can see the full reference and a link to the paper itself.  


Abstract: Mesa is an open-source agent-based modeling (ABM) framework implemented in the Python programming language, allowing users to build and visualize agent-based models. It has been used in a diverse range of application areas over the years ranging from biology to workforce dynamics. However, there has been no direct support for integrating geographical data from geographical information systems (GIS) into models created with Mesa. Users have had to rely on their own implementations to meet such needs. In this paper we present Mesa-Geo, a GIS extension for Mesa, which allows users to import, manipulate, visualize and export geographical data for ABM. We introduce the main components and functionalities of Mesa-Geo, followed by example applications utilizing geographical data which demonstrates Mesa-Geo's core functionalities and features common to agent-based models. Finally, we conclude with a discussion and outlook on future directions for Mesa-Geo.

Class diagram of the Agent, GeoAgent, and Cell classes
Component diagram of GeoSpace and its related classes
Example applications using Mesa and Mesa-Geo: (a) Rainfall model, (b) Population model, (c) GeoSchelling (polygons) model, (d) GeoSchelling (points \& polygons) model, and (e) Agents and networks model.


 If you have any thoughts or comments about Mesa-Geo please let us know.

Full reference:

Wang, B., Hess, V. and Crooks A.T. (2023), Mesa-Geo: A GIS Extension for the Mesa Agent-Based Modeling Framework in Python, Proceedings of the 5th ACM SIGSPATIAL International Workshop on Geospatial Simulation (GeoSim 2022), Seattle, WA. pp 1-10. (PDF)

Friday, October 28, 2022

Modeling Farmers’ Adoption Potential to New Bioenergy Crops

Close on the heals of the last post on farming, we have a new paper co-authored with Kazi Masel entitled "Modelling Farmers’ Adoption Potential to New Bioenergy Crops: An Agent-based Approach" which was presented at the 2022 Computational Social Science Society of the Americas (CSS 2022) Annual Conference. In the paper we explore the potential of farmers to adopt carinata in the state of Georgia. Carinata in an oilseed crop which could be used as a sustainable aviation fuel. Through our agent-based model our results suggest that a viable contract price made by investors could persuade farmers to adopt carinata. If this sounds of interest, below we provide the abstract to the paper along with a movie showing the model running along with some figures of the model logic and an example of one of the results. At the bottom of the post you can find the full reference to the paper and a link to a pdf of it. Similar to our other papers a detailed Overview, Design concepts and Details (ODD) protocol along with the model and the data needed to run the model has been made available at https://www.comses.net/codebase-release/5c2c06f0-3f6d-4f8d-b198-ce24b55feb2f/. This additional material allows for a more in-depth description of the model, as well as facilitates the replication of results or extension of the model.

Abstract: The use of fossil fuels is the primary source of greenhouse gas emissions but there are alternatives to these especially in the form of biofuels, fuels derived from bioenergy crops. This paper aims to determine farmers’ potential adoption rates of newly introduced bioenergy crops with a specific example of carinata in the state of Georgia. The determination is done using an agent-based modeling technique with two principal assumptions – farmers are profit maximizer and they are influenced by neighboring farmers. Two diffusion parameters (traditional and expansion) are followed along with two willingness (high and low) scenarios to switch at varying production economics to carinata and other prominent traditional field crops (cotton, peanuts, corn) in the study region. The paper finds that a contract prices around $9, $8 and $7 can be a viable option for encouraging farmers to adopt carinata in low, average, and high profit conditions, respectively. Expansion diffusion (that diffuses all over the geographical area), rather than centered to the few places like traditional diffusion at the early stage of adoption in conjunction with higher willingness conditions influences higher adoption rates in the short-term. As such, the model can be used to understand the behavioral economics of carinata in Georgia and beyond, as well as offering a potential tool to study similar bioenergy crops.
Keywords: Adoption, Agent-based modeling, Bioenergy Crops, Farming.
County-wise land availability for carinata production
Process, overview and scheduling of the model
Number of farmers who adopt carinata in the rotation years with high profit condition  (carinata yield = 60 bu/acre, carinata production cost = $260/acre)

Full Reference:

Ullah, K. and Crooks A.T., (2022), Modelling Farmers’ Adoption Potential to New Bioenergy Crops: An Agent-based Approach, The 2022 Computational Social Science Society of Americas Conference, Santa Fe, NM. (PDF)

Thursday, October 27, 2022

Water reuse adoption by farmers & the impacts on local water resources using an ABM

In the past we heave explored a how farmers might sell their land but not how they might adapt new technologies or farming practices such as water reuse. But this has now changed with a new paper co-authored with Farshid Shoushtarian and  Masoud Negahban-Azar entitled "Investigating the micro-level dynamics of water reuse adoption by farmers and the impacts on local water resources using an agent-based model" which was recently published in the journal Socio-Environmental Systems Modelling. In the paper we introduce the WRAF  (water  reuse  adoption  by  farmers) model which explores how farmers might adopt water recycled water (reuse) practices. Using the model, results suggest that it might be possible through freshwater shortage or groundwater withdrawal regulations could increase recycled water use by farmers. If this sounds of interest, below we provide an abstract to the model, some figures from the agent logic (i.e., decision making), an overview of simulation results and the  full reference to the paper. Along with the paper, we have also provided more details  about the WRAF  model following the Overview, Design concepts, Details, and Decision-making (ODD) protocol along with the  NetLogo source code which can be found at https://www.comses.net/codebase-release/cc6d551e-cf0f-472e-a54b-28591cd39b4d/.


Abstract: Agricultural water reuse is gaining momentum to address freshwater scarcity worldwide. The main objective of this paper was to investigate the micro-level dynamics of water reuse adoption by farmers at the watershed scale. An agent-based model was developed to simulate agricultural water consumption and socio-hydrological dynamics. Using a case study in California, the developed model was tested, and the results showed that agricultural water reuse adoption by farmers is a gradual and time-consuming process. In addition, results also showed that agricultural water reuse could significantly decrease the water shortage (by 57.7%) and groundwater withdrawal (by 74.1%). Furthermore, our results suggest that recycled water price was the most influential factor in total recycled water consumption by farmers. Results also showed how possible freshwater shortage or groundwater withdrawal regulations could increase recycled water use by farmers. The developed model can significantly help assess how the current water reuse management practices and strategies would affect the sustainability of agricultural water resources.

Keywords: Water reuse; agent-based modelling; agricultural water management; recycled water for irrigation


(a) WRAF framework; (b) Farmers' decision-making flowchart

(a) Water reuse adoption sub-model framework; (b) Wastewater treatment plants flowchart

Representative simulation results: farmers’ water resources distribution in year one (a) andyear84(b);  available recycled water in the storage ponds of Modesto (c) and Turlock (d)wastewater treatment plants; total recycled water used by farmers in year two (e) and year 84(f)

Full Reference:

Shoushtarian, F., Negahban-Azar, M. and Crooks A.T. (2022), Investigating the Micro-level Dynamics of Water Reuse Adoption by Farmers and the Impacts on Local Water Resources using an Agent-based Model, Socio-Environmental Systems Modelling, 4: 18148. Available at https://doi.org/10.18174/sesmo.18148. (pdf)


Wednesday, September 21, 2022

Mitigation of Supply Chain Disruptions by Criminal Agents

Since the outbreak of COVID, the role of supply chains has been brought front and center in many aspects of our daily lives. For example, the disruption to supply chains can significantly influence the operation of the world economy and this has been shown to permeate and affect a large majority of countries and their citizens. However, it is not just diseases outbreaks that can affect them, but also criminal agents. To this end at the 15th International Conference on Social Computing, Behavioral-Cultural Modeling & Prediction and Behavior Representation in Modeling and Simulation (or SBP-BRiMs for short), Abhisekh Rana, Hamdi Kavak, Sean Luke, Carlotta DomeniconiJim Jones and myself have a paper entitled "Mitigation of Optimized Pharmaceutical Supply Chain Disruptions by Criminal Agents."

The paper presents some initial results from a model that explores the disruptions to supply chains by a criminal agent and possible mitigation strategies. We construct a model of a typical pharmaceutical manufacturing supply chain, which is implemented via discrete event simulation. The criminal agent optimizes its resource allocation using a CMA-ES algorithm to maximize disruption to the supply chain. CMA-ES is part of a family of sample-based optimization techniques collectively known as evolutionary algorithms.  Broadly speaking, CMA-ES starts with a sample of random candidate solutions to optimize.  It then iteratively assesses the quality of each candidate solution, then performs resampling based on their quality to produce a new sample of candidates. By combining our supply chain model with our criminal agent, and by leveraging CMA-ES, we attempt to identify the main bottlenecks and the most vulnerable points in the pharmaceutical supply chain. Our findings show criminal agents can cause cascading damage and exploit vulnerabilities, which inherently exist within the supply chain itself. We also demonstrate how basic mitigation strategies can efficaciously alleviate this potential damage.  If this sounds of interest, below we provide the abstract to the paper, along with some of the key figures and at the bottom of the post the full reference and a link to the paper.

Abstract: 

Disruption to supply chains can significantly influence the operation of the world economy and this has been shown to permeate and affect a large majority of countries and their citizens. We present initial results from a model that explores the disruptions to supply chains by a criminal agent and possible mitigation strategies. We construct a model of a typical pharmaceutical manufacturing supply chain, which is implemented via discrete event simulation. The criminal agent optimizes its resource allocation to maximize disruption to the supply chain. Our findings show criminal agents can cause cascading damage and exploit vulnerabilities, which inherently exist within the supply chain itself. We also demonstrate how basic mitigation strategies can efficaciously alleviate this potential damage. 

Keywords: Pharmaceutical supply chains, Criminal agents, Evolutionary computation, Mitigation.

A simplified version of a typical pharmaceutical supply chain.

Design of the criminal agent.
Sample simulations for the baseline model, without any disruption, and attacks at the five main disruption points in the supply chain.

Summary statistics and sample simulations for CMAES optimized disruptions with and without mitigation in place.

Full Reference:

Rana, R., Kavak, H., Crooks, A.T., Domeniconi, C., Luke, S. and Jones, J. (2022), Mitigation of Optimized Pharmaceutical Supply Chain Disruptions by Criminal Agents, in Thomson, R., Dancy, C. and Pyke, P. (eds), Proceedings of the 2022 International Conference on Social Computing, Behavioral-Cultural Modeling, & Prediction and Behavior Representation in Modeling and Simulation, Pittsburgh, PA., pp 13-23. (pdf)


Monday, September 19, 2022

Information propagation on cyber, relational and physical spaces about covid-19 vaccine

It seems that its been a quite some time that we posted about geosocial analysis but in a recent paper with  Fuzhen Yin  and Li Yin entitled "Information Propagation on Cyber, Relational and Physical Spaces about Covid-19 Vaccine: Using Social Media and the Splatial Framework" published in Computers, Environment and Urban Systems we revisit this line of work while at the same time linking it to Covid and vaccination debates. 

Specifically we examine the interaction between cyber, relational (i.e, networks between objects), and physical spaces using the Splatial framework. Through our analysis focused on New York State, we find that non-polarized vaccination debates were observed in cyber, relational, and physical spaces. Furthermore,  we found that while physical space users had less anti-vaccine stance than relational and cyber space users there were strong interactions are observed between physical–relational, and relational-cyber spaces.If this sort of thing interests you. Below we provide the abstract to the paper along with some figures which show the study area, our methodology and some of the results. While at the bottom of the post we provide the full reference and the link to the paper.

Abstract:

With the advent of social media, human dynamics studied in purely physical space have been extended to that of a cyber and relational context. However, connections and interactions between these hybrid spaces have not been sufficiently investigated. The “space-place (Splatial)” framework proposed in recent years allows capturing human activities in the hybrid of spaces. This study applies the Splatial framework to examine the information propagation between cyber, relational, and physical spaces through a case study of Covid-19 vaccine debates in New York State (NYS). Whereby the physical space represents the regional boundaries and locations of social media (i.e., Twitter) users in NYS, the relational space indicates the social networks of these NYS users, and the cyber space captures the larger conversational context of the vaccination debate. Our results suggest that the Covid-19 vaccine debate is not polarized across all three spaces as compared to that of other vaccines. However, the rate of users with a pro-vaccine stance decreases from physical to relational and cyber spaces. We also found that while users from different spaces interact with each other, they also engage in local communications with users from the same region or same space, and distance-based and boundary-confined clusters exist in cyber and relational space communities. These results based on the Splatial framework not only shed light on the vaccination debates but also help to define and elucidate the relationships between the three spaces. The intense interactions between spaces suggest incorporating people’s relational network and cyber presence in physical place-making.

Keywords: Covid-19, Vaccination, Social media, Social network analysis, Community detection, Urban informatics
Schematic representation of the three spaces: cyber, relational and physical spaces.

Map of study area (NYS) with the primary road system. Red dots denote collected vaccine-related tweets in NYS.

Research workflow to investigate the propagation of different opinions between three spaces: cyber, relational and physical spaces.

Network visualization of the eight top large communities in relational space. (A) Visualization of communities using ForceAtlas layout. (B) Project communities into physical space. Nodes without location information are placed outside of NYS.

The hybrid space network shows the information propagation between physical and relational spaces. (A) shows the network of all tweets, (B) shows the pro-vaccine tweets, and (C) shows the anti-vaccine tweets.
 
Full Reference:

Yin, F., Crooks, A.T. and Yin, L. (2022), Information Propagation on Cyber, Relational and Physical Spaces about Covid-19 Vaccine: Using Social Media and the Splatial Framework, Computers, Environment and Urban Systems. Available at: https://doi.org/10.1016/j.compenvurbsys.2022.101887.  (pdf)

Wednesday, August 31, 2022

Mesa-Geo: ABM and GIS in Python

In the past I have blogged a lot on creating geographically explicit models in NetLogo, Repast and Mason but not so much about models created in Python. Even though Python is growing in popularity and their exists an agent-based modeling framework in Python called Mesa (click here to see a paper on this). But this lack of blogging about geographically explicit agent-based models will be changing as I have been recently working with Boyu Wang (a PhD student here at UB) who together with others have been developing Mesa-Geo. To give you as sense of Mesa-Geo, below are some example models that can be downloaded from https://github.com/projectmesa/mesa-geo or https://github.com/wang-boyu/agents-and-networks-in-python. These models range from rainfall flowing over a digital terrain model to Schelling types of models using points  and polygons as agents, to that of agents using road networks to navigate over an area.  In a future post we will go into more details but if you are interested in creating geographically explicit agent-based models in Python please check out the repositories.

 Mesa-Geo example models: (a) Rainfall, (b) Population, (c) Schelling (polygons) , (d) Schelling (points & polygons), and (e) Agents and networks.

Thursday, July 14, 2022

Drone strikes and radicalization

In the past we had posted on models of radicalization, but such models were rather abstract.  Building on this previous work Brandon Shapiro and myself have a new paper entitled "Drone Strikes and Radicalization: An Exploration Utilizing Agent-Based Modeling and Data Applied to Pakistan" which has recently been published in Computational and Mathematical Organization Theory journal. In the paper we develop and present an agent-based model informed by theory and calibrated using empirical data to explore the relationship between kinetic actions (i.e., drone strikes) and terrorist attacks in Pakistan from 2004 through 2018. 

The data itself came from the Bureau of Investigative Journalism data as our source for Pakistan drone strikes (i.e., kinetic actions) and the National Consortium for the Study of Terrorism and Responses to Terrorism( START)  Global Terrorism Database (GTD) as our source for terrorist incidents. Rather than try to pinpoint and define the motivating factors which might influence somebody down a path toward radicalization, our model that incorporated a distributed lag model to characterize the inter-dependencies between drone strikes and terrorist attacks observed in Pakistan. Based on parametric and validation tests, the model simulates a terrorist attack curve which approximates the rate and magnitude observed in Pakistan from 2007 through 2018. 

If this sounds of interest, below we provide the abstract to the paper, along with some images of model graphical user interface, the model logic and some of the results. The model itself was created in NetLogo and is available at: https://www.comses.net/codebase-release/30540ae3-486b-44e4-8ff0-785575433af0/  (along with the data and detailed ODD of the model). At the bottom of the page you can find the full citation and a link to the paper.

Abstract:

The employment of drone strikes has been ongoing and the public continues to debate their perceived benefits. A question that persists is whether drone strikes contribute to an increase in radicalization. This paper presents a data-driven approach to explore the relationship between drone strikes conducted in Pakistan and subsequent responses, often in the form of terrorist attacks carried out by those in the communities targeted by these particular counter terrorism measures. Our exploration and analysis of news reports which discussed drone strikes and radicalization suggest that government-sanctioned drone strikes in Pakistan appear to drive terrorist events with a distributed lag that can be determined analytically. We leverage news reports to inform and calibrate an agent-based model grounded in radicalization and opinion dynamics theory. This enabled us to simulate terrorist attacks that approximated the rate and magnitude observed in Pakistan from 2007 through 2018. We argue that this research effort advances the field of radicalization and lays the foundation for further work in the area of data-driven modeling and drone strikes.  
Keywords: Radicalization, Data-driven modeling, Drone strikes, Terrorism, Pakistan , Agent-based modeling.
Pakistan radicalization model’s graphical user interface. From left to right: model input param- eters, the agents’ social network and resulting model outputs

The agent-based model flow diagram.

Terrorist attacks simulated by Pakistan radicalization model qualitatively agree with real-world system.

Full Reference: 

Shapiro, B. and Crooks, A.T. (2022) Drone Strikes and Radicalization: An Exploration Utilizing Agent-Based Modeling and Data Applied to Pakistan, Computational and Mathematical Organization Theory. Available at https://doi.org/10.1007/s10588-022-09364-1. (pdf)


Thursday, July 07, 2022

Call for papers: GeoSim 2022

The GeoSim 2022 workshop focuses on all aspects of geospatial simulation as a paradigm to understand, model, and predict spatial phenomena and aid decision making. New simulation methodologies and frameworks, not necessarily coming from the SIGSPATIAL community, are encouraged to participate. Also, this workshop is of interest to everyone who works with spatial data. The simulation methods that will be presented and discussed in the workshop should find a wide application across the community by producing benchmark datasets that can be parameterized and scaled. Simulated data sets will be made available to the community via the website.

The workshop seeks high-quality full (8-10 pages) and short (up to 4 pages) papers that will be peer-reviewed. Once accepted, at least one author is required to register for the workshop and the ACM SIGSPATIAL conference, as well as attend the workshop to present the accepted work which will then appear in the ACM Digital Library.

We solicit novel and previously unpublished research on all topics related to geospatial simulation including, but not limited to:
  • Disease Spread Simulation
  • Urban Simulation
  • Agent Based Models for Spatial Simulation
  • Multi-Agent Based Spatial Simulation
  • Big Spatial Data Simulation
  • Spatial Data/Trajectory Generators
  • Environmental Simulation
  • GIS using Spatial Simulation
  • Modeling and Simulation of COVID-19
  • Interactive Spatial Simulation
  • Spatial Simulation Parallelization and Distribution
  • Geo-Social Simulation and Data Generators
  • Social Unrest and Riot Prediction using Simulation
  • Spatial Analysis based on Simulation
  • Behavioral Simulation
  • Verifying, and Validating Spatial Simulation
  • Applications for Spatial Simulation


Workshop information

Submission deadline: September 01, 2022
Author Notification: September 27, 2022
Workshop date: November 01, 2022


Workshop website: http://www.geosim.org
Submission site: https://easychair.org/conferences/?conf=geosim2022


Wednesday, June 01, 2022

Sample Models from Spatial Simulation (Spring 2022)

Continuing the tradition of making a post of some of the models developed by students in my classes as part of their end of semester projects, this spring I taught a graduate class entitled “Spatial Simulation” (the course description is below for these who are interested). 

For many, this is their first exposure to agent-based and cellular automata (CA) modeling. As part of the class the students were expected to complete an end of semester project, in this case, develop an agent-based or CA model that explores some aspect of the course themes.   The movie below shows a selection of these projects which ranged from how fish respond to turbulence to that of land use change over years and several other  topics in-between.

Coarse Description:

This graduate course will introduce students in the geographical and environmental sciences to the use of spatial simulation methods (e.g., cellular automata, agent-based modeling) to explore complex geographical phenomena from the bottom up. For example, how the micro-movement of pedestrians lead to the emergence of crowds or how individuals buying and selling houses lead to property markets forming. We will cover geographical applications in areas such as agriculture, biodiversity, interactions between human populations and nonhuman species and cities. Emphasis will be placed on the notion that geographical systems are constantly changing at various spatiotemporal scales and how through spatial simulation we can gain an understanding of the processes that lead to patterns that we can observe through data. The course will combine taught classes, literature reviews and discussions with hands-on spatial simulation modeling. The format of the class will consist of both lecture and discussion, with substantial emphasis on student participation.


Tuesday, May 10, 2022

Analyzing the vaccination debate in social media data Pre- and Post-COVID-19 pandemic

In the past we have written about how vaccination is discussed on social media but such studies were often just focused on short study periods (i.e. a month). However, with the current COVID-19 pandemic we thought we would revisit the vaccination  debate and see if it has changed. So in a new paper with Qingqing Chen entitled "Analyzing the vaccination debate in social media data Pre- and Post-COVID-19 pandemic," we did just that. We explored approximately 11.7 million tweets posted between January 2015 to July 2021 and measured and mapped vaccine sentiments (Pro-vaccine, Anti-vaccine, and Neutral) across the US. Not to ruin the surprise of what we found but also to encourage you to read the paper we will not write about the results here. Only show the abstract of the paper, a few of the figures and a link to the paper itself.

Abstract

The COVID-19 virus has caused and continues to cause unprecedented impacts on the life trajectories of millions of people globally. Recently, to combat the transmission of the virus, vaccination campaigns around the world have become prevalent. However, while many see such campaigns as positive (e.g., protecting lives), others see them as negative (e.g., the side effects that are not fully understood scientifically), resulting in diverse sentiments towards vaccination campaigns. In addition, the diverse sentiments have seldom been systematically quantified let alone their dynamic changes over space and time. To shed light on this issue, we propose an approach to analyze vaccine sentiments in space and time by using supervised machine learning combined with word embedding techniques. Taking the United States as a test case, we utilize a Twitter dataset (approximately 11.7 million tweets) from January 2015 to July 2021 and measure and map vaccine sentiments (Pro-vaccine, Anti-vaccine, and Neutral) across the nation. In doing so, we can capture the heterogeneous public opinions within social media discussions regarding vaccination among states. Results show how positive sentiment in social media has a strong correlation with the actual vaccinated population. Furthermore, we introduce a simple ratio between Anti and Pro-vaccine as a proxy to quantify vaccine hesitancy and show how our results align with other traditional survey approaches. The proposed approach illustrates the potential to monitor the dynamics of vaccine opinion distribution online, which we hope, can be helpful to explain vaccination rates for the ongoing COVID-19 pandemic.

Keywords: COVID-19, Pandemic, Vaccination Sentiment Analysis, Time and Space, Social Media, United States.

Overview of our research pipeline.

Comparison between Twitter data and Google Trends. (a) Distribution of keywords search and tweets over time; (b) Correlation between Google Trends and Twitter data of keywords search; (c) Important news or announcements catched on Twitter activity (Note: period is the shaded area in (a)).

Correlation between Pro-vaccine users and actual vaccination records (a) Spatial distribution of odds ratio of Pro-vaccine users; (b) Spatial distribution of odds ratio of actual vaccination records; (c) Correlation between the Pro-vaccine users and the actual vaccination records.

Full Reference: 

Chen, Q. and Crooks, A.T. (2022), Analyzing the Vaccination Debate in Social Media Data Pre- and Post-COVID-19 Pandemic, International Journal of Applied Earth Observation and Geoinformation, 110: 102783.  Available at https://doi.org/10.1016/j.jag.2022.102783 (pdf)


Friday, April 22, 2022

Segregation models and urban studies

A couple of weeks ago I got to watch a talk by Itzhak Benenson and Erez Hatna who discussed the Schelling model and its impact on urban studies and thought it was worth sharing here. This talk was part of the Urban Models Seminar Series from the TU-Delft Urbanism group. The group has a great collection of other talks on their YouTube channel which are worth checking out.  

Wednesday, March 16, 2022

Leveraging Street Level Imagery for Urban Planning

Just a short post that say that  Linda See and myself have a new editorial in Environment and Planning B: Urban Analytics and City Science entitled " Leveraging Street Level Imagery for Urban Planning." While in the in the past we have written about street view imagery and how there are initiatives like KartaView (previously named OpenStreetView and OpenStreetCam) and Mapillary which allow for the collection of volunteered street view imagery (VSVI) using just smartphones. But we have not really delved much into how such initiatives could be used to assist assist urban planning (e.,g. change detection, augmented reality (AR) and urban navigation).  If this sounds of interest,  please feel free to check out our editorial here

Exploring urban change in Buffalo, New York with Google Street View in October 2020 and the same location in the 2007 inset.

 Full Reference:

Crooks, A.T. and See, L. (2022), Leveraging Street Level Imagery for Urban Planning, Environment and Planning B, https://doi.org/10.1177/23998083221083364

Thursday, February 17, 2022

New Paper: Synthetic Populations with Social Networks

When developing geographically explicit agent-based models, one thing we spend a lot of time on is building synthetic populations and then linking the agents in the synthetic population to each other.  To overcome this issue we have a new paper published in "Computational Urban Science " entitled "A method to create a synthetic population with social networks for geographically-explicit agent-based models" In this paper  Na (Richard) Jiang, Hamdi Kavak, Annetta Burger, William Kennedy and myself present a synthetic population generation method that also includes social networks and use the New York Metro as a study site, which covers an area of 262 x 234 km and is home to over 23 million people. 

To show the utility of this method we also present three simple applications (e.g., a disease , a disaster  and a traffic model) which utilize different parts of this synthetic population but are all geographically explicit and use networks in some shape or form. If this sounds of interest, below you can read the abstract from the paper, along with seeing some of the figures from our methodology and example applications. While at the bottom of the post we provide the full citation and a link to the paper. The paper itself also has links to actual code that generates the synthetic population and the resulting datasets and models  (code: https://bit.ly/SynPopABM; source and resulting synthetic population data: https://osf.io/3vsaj/) .  

Abstract

Geographically-explicit simulations have become crucial in understanding cities and are playing an important role in urban science. One such approach is that of agent-based modeling which allows us to explore how agents interact with the environment and each other (e.g., social networks), and how through such interactions aggregate patterns emerge (e.g., disease outbreaks, traffic jams). While the use of agent-based modeling has grown, one challenge remains, that of creating realistic, geographically-explicit, synthetic populations which incorporate social networks. To address this challenge, this paper presents a novel method to create a synthetic population which incorporates social networks using the New York Metro Area as a test area. To demonstrate the generalizability of our synthetic population method and data to initialize models, three different types of agent-based models are introduced to explore a variety of urban problems: traffic, disaster response, and the spread of disease. These use cases not only demonstrate how our geographically-explicit synthetic population can be easily utilized for initializing agent populations which can explore a variety of urban problems, but also show how social networks can be integrated into such populations and large-scale simulations.

Keywords: Synthetic Population Generation, Agent-Based Modeling, New York, Traffic Dynamics, Disease, Disaster

Study Area

Workflow for Generation of Synthetic Population and Networks

Creation of Social Networks: (a) Selected Population; (b) Creation of a Household Network; (c) Creation of Work and Educational Networks for each Member of the Household; (d) The Household, its Networks within the Full Census Tract

Model Component Structure of Population Respond to Disaster event

Agents’ Health Status After 1 Minute of the Disaster Event

Full Reference:

Jiang, N., Crooks, A.T., Kavak, H., Burger, A. and Kennedy, W.G. (2022), A Method to Create a Synthetic Population with Social Networks for Geographically Explicit Agent-Based Models, Computational Urban Science, 2:7. Available at https://doi.org/10.1007/s43762-022-00034-1

Monday, January 24, 2022

Using GIS data to Build a Segregation Model in NetLogo

While our book "Agent-based Modelling and Geographical Information Systems" has a lot of details and examples about how to use GIS data within NetLogo (see https://github.com/abmgis/abmgis), as I was  preparing for my course this semester entitled "Spatial Simulation" I thought I would develop a more detailed tutorial on how to use vector data to build a segregation model in NetLogo. The model itself is inspired by Schelling's model of segregation, but unlike the regular cell versions which are commonly used as examples here the cells are polygons which are based on census boundaries of Washington DC. The movie below gives a sense of what it looks like when completed. 


If you are interested in how this was built and want relativity step by step instructions click here to download a zip file of the completed model, the shapefile and a pdf.  Alternatively just go to https://github.com/abmgis/abmgis/tree/master/Chapter06-IntegratingABMandGIS and download the Segregation Tutorial. I hope you find this useful.