Thursday, July 07, 2022

Call for papers: GeoSim 2022

The GeoSim 2022 workshop focuses on all aspects of geospatial simulation as a paradigm to understand, model, and predict spatial phenomena and aid decision making. New simulation methodologies and frameworks, not necessarily coming from the SIGSPATIAL community, are encouraged to participate. Also, this workshop is of interest to everyone who works with spatial data. The simulation methods that will be presented and discussed in the workshop should find a wide application across the community by producing benchmark datasets that can be parameterized and scaled. Simulated data sets will be made available to the community via the website.

The workshop seeks high-quality full (8-10 pages) and short (up to 4 pages) papers that will be peer-reviewed. Once accepted, at least one author is required to register for the workshop and the ACM SIGSPATIAL conference, as well as attend the workshop to present the accepted work which will then appear in the ACM Digital Library.

We solicit novel and previously unpublished research on all topics related to geospatial simulation including, but not limited to:
  • Disease Spread Simulation
  • Urban Simulation
  • Agent Based Models for Spatial Simulation
  • Multi-Agent Based Spatial Simulation
  • Big Spatial Data Simulation
  • Spatial Data/Trajectory Generators
  • Environmental Simulation
  • GIS using Spatial Simulation
  • Modeling and Simulation of COVID-19
  • Interactive Spatial Simulation
  • Spatial Simulation Parallelization and Distribution
  • Geo-Social Simulation and Data Generators
  • Social Unrest and Riot Prediction using Simulation
  • Spatial Analysis based on Simulation
  • Behavioral Simulation
  • Verifying, and Validating Spatial Simulation
  • Applications for Spatial Simulation


Workshop information

Submission deadline: September 01, 2022
Author Notification: September 27, 2022
Workshop date: November 01, 2022


Workshop website: http://www.geosim.org
Submission site: https://easychair.org/conferences/?conf=geosim2022


Wednesday, June 01, 2022

Sample Models from Spatial Simulation (Spring 2022)

Continuing the tradition of making a post of some of the models developed by students in my classes as part of their end of semester projects, this spring I taught a graduate class entitled “Spatial Simulation” (the course description is below for these who are interested). 

For many, this is their first exposure to agent-based and cellular automata (CA) modeling. As part of the class the students were expected to complete an end of semester project, in this case, develop an agent-based or CA model that explores some aspect of the course themes.   The movie below shows a selection of these projects which ranged from how fish respond to turbulence to that of land use change over years and several other  topics in-between.

Coarse Description:

This graduate course will introduce students in the geographical and environmental sciences to the use of spatial simulation methods (e.g., cellular automata, agent-based modeling) to explore complex geographical phenomena from the bottom up. For example, how the micro-movement of pedestrians lead to the emergence of crowds or how individuals buying and selling houses lead to property markets forming. We will cover geographical applications in areas such as agriculture, biodiversity, interactions between human populations and nonhuman species and cities. Emphasis will be placed on the notion that geographical systems are constantly changing at various spatiotemporal scales and how through spatial simulation we can gain an understanding of the processes that lead to patterns that we can observe through data. The course will combine taught classes, literature reviews and discussions with hands-on spatial simulation modeling. The format of the class will consist of both lecture and discussion, with substantial emphasis on student participation.


Tuesday, May 10, 2022

Analyzing the vaccination debate in social media data Pre- and Post-COVID-19 pandemic

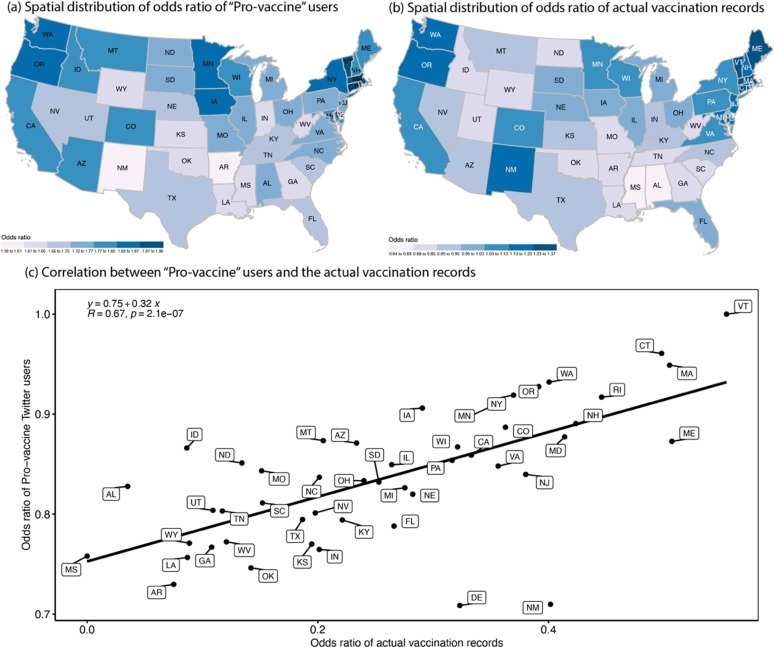
In the past we have written about how vaccination is discussed on social media but such studies were often just focused on short study periods (i.e. a month). However, with the current COVID-19 pandemic we thought we would revisit the vaccination  debate and see if it has changed. So in a new paper with Qingqing Chen entitled "Analyzing the vaccination debate in social media data Pre- and Post-COVID-19 pandemic," we did just that. We explored approximately 11.7 million tweets posted between January 2015 to July 2021 and measured and mapped vaccine sentiments (Pro-vaccine, Anti-vaccine, and Neutral) across the US. Not to ruin the surprise of what we found but also to encourage you to read the paper we will not write about the results here. Only show the abstract of the paper, a few of the figures and a link to the paper itself.

Abstract

The COVID-19 virus has caused and continues to cause unprecedented impacts on the life trajectories of millions of people globally. Recently, to combat the transmission of the virus, vaccination campaigns around the world have become prevalent. However, while many see such campaigns as positive (e.g., protecting lives), others see them as negative (e.g., the side effects that are not fully understood scientifically), resulting in diverse sentiments towards vaccination campaigns. In addition, the diverse sentiments have seldom been systematically quantified let alone their dynamic changes over space and time. To shed light on this issue, we propose an approach to analyze vaccine sentiments in space and time by using supervised machine learning combined with word embedding techniques. Taking the United States as a test case, we utilize a Twitter dataset (approximately 11.7 million tweets) from January 2015 to July 2021 and measure and map vaccine sentiments (Pro-vaccine, Anti-vaccine, and Neutral) across the nation. In doing so, we can capture the heterogeneous public opinions within social media discussions regarding vaccination among states. Results show how positive sentiment in social media has a strong correlation with the actual vaccinated population. Furthermore, we introduce a simple ratio between Anti and Pro-vaccine as a proxy to quantify vaccine hesitancy and show how our results align with other traditional survey approaches. The proposed approach illustrates the potential to monitor the dynamics of vaccine opinion distribution online, which we hope, can be helpful to explain vaccination rates for the ongoing COVID-19 pandemic.

Keywords: COVID-19, Pandemic, Vaccination Sentiment Analysis, Time and Space, Social Media, United States.

Overview of our research pipeline.

Comparison between Twitter data and Google Trends. (a) Distribution of keywords search and tweets over time; (b) Correlation between Google Trends and Twitter data of keywords search; (c) Important news or announcements catched on Twitter activity (Note: period is the shaded area in (a)).

Correlation between Pro-vaccine users and actual vaccination records (a) Spatial distribution of odds ratio of Pro-vaccine users; (b) Spatial distribution of odds ratio of actual vaccination records; (c) Correlation between the Pro-vaccine users and the actual vaccination records.

Full Reference: 

Chen, Q. and Crooks, A.T. (2022), Analyzing the Vaccination Debate in Social Media Data Pre- and Post-COVID-19 Pandemic, International Journal of Applied Earth Observation and Geoinformation, 110: 102783.  Available at https://doi.org/10.1016/j.jag.2022.102783 (pdf)


Friday, April 22, 2022

Segregation models and urban studies

A couple of weeks ago I got to watch a talk by Itzhak Benenson and Erez Hatna who discussed the Schelling model and its impact on urban studies and thought it was worth sharing here. This talk was part of the Urban Models Seminar Series from the TU-Delft Urbanism group. The group has a great collection of other talks on their YouTube channel which are worth checking out.  

Wednesday, March 16, 2022

Leveraging Street Level Imagery for Urban Planning

Just a short post that say that  Linda See and myself have a new editorial in Environment and Planning B: Urban Analytics and City Science entitled " Leveraging Street Level Imagery for Urban Planning." While in the in the past we have written about street view imagery and how there are initiatives like KartaView (previously named OpenStreetView and OpenStreetCam) and Mapillary which allow for the collection of volunteered street view imagery (VSVI) using just smartphones. But we have not really delved much into how such initiatives could be used to assist assist urban planning (e.,g. change detection, augmented reality (AR) and urban navigation).  If this sounds of interest,  please feel free to check out our editorial here

Exploring urban change in Buffalo, New York with Google Street View in October 2020 and the same location in the 2007 inset.

 Full Reference:

Crooks, A.T. and See, L. (2022), Leveraging Street Level Imagery for Urban Planning, Environment and Planning B, https://doi.org/10.1177/23998083221083364