In the paper we use social, demographic and economic (e.g., US Census) variables to predict COVID-19 vaccine hesitancy levels in the ten most populous US metropolitan statistical areas (MSAs). By using machine learning algorithms (e.g., linear regression, random forest regression, and XGBoost regression) we compare a set of baseline models that contain only these variables with models that incorporate survey data and social media (i.e., Twitter) data separately.
We find that different algorithms perform differently along with variations in influential variables such as age, ethnicity, occupation, and political inclination across the five hesitancy classes (e.g., “definitely get a vaccine”, “probably get a vaccine”, “unsure”, “probably not get a vaccine”, and “definitely not get a vaccine”). Further, we find that the application of the models to different MSAs yields mixed results, emphasizing the uniqueness of communities and the need for complementary data approaches. But in summary, this paper shows social media data’s potential for understanding vaccine hesitancy, and tailoring interventions to specific communities. If this sounds of interest, below we provide the abstract to the paper along with our mixed methods matrix, data sources used and the results from the various MSAs. At the bottom of the post, you cans see the full reference and the link to the paper so you can read more if you so desire.
Abstract:
The COVID-19 pandemic prompted governments worldwide to implement a range of containment measures, including mass gathering restrictions, social distancing, and school closures. Despite these efforts, vaccines continue to be the safest and most effective means of combating such viruses. Yet, vaccine hesitancy persists, posing a significant public health concern, particularly with the emergence of new COVID-19 variants. To effectively address this issue, timely data is crucial for understanding the various factors contributing to vaccine hesitancy. While previous research has largely relied on traditional surveys for this information, recent sources of data, such as social media, have gained attention. However, the potential of social media data as a reliable proxy for information on population hesitancy, especially when compared with survey data, remains underexplored. This paper aims to bridge this gap. Our approach uses social, demographic, and economic data to predict vaccine hesitancy levels in the ten most populous US metropolitan areas. We employ machine learning algorithms to compare a set of baseline models that contain only these variables with models that incorporate survey data and social media data separately. Our results show that XGBoost algorithm consistently outperforms Random Forest and Linear Regression, with marginal differences between Random Forest and XGBoost. This was especially the case with models that incorporate survey or social media data, thus highlighting the promise of the latter data as a complementary information source. Results also reveal variations in influential variables across the five hesitancy classes, such as age, ethnicity, occupation, and political inclination. Further, the application of models to different MSAs yields mixed results, emphasizing the uniqueness of communities and the need for complementary data approaches. In summary, this study underscores social media data’s potential for understanding vaccine hesitancy, emphasizes the importance of tailoring interventions to specific communities, and suggests the value of combining different data sources.
Mixed methods matrix showing the data, processing, and model development steps used in our study.
Data sources used in our study.
MSA model performance (Bolded adjusted R2 values represent the best performing model for each modeling technique and MSA).
Do vaccine discussions on Twitter show a
highly clustered pattern in the sense that users tend to
communicate more often with those who have same opinions
towards vaccination than those who do not?
If the
communication is highly clustered, to what extent do pro-vaccine
users reach out to anti-vaccine users
and vice versa?
How much do social bots,
computer algorithms designed to mimic human behavior and
interact with humans in an automated fashion, contribute to
the conversation as previous research has shown that social
bots can have certain impact on human communication in
social media?
In order to answer these
questions, we use a variety of machine learning techniques (e.g. logistic regression, support vector machine (e.g. linear
and non-linear kernel), k-nearest neighbors, nearest centroid,
and Naïve Bayes) trained with labeled data (which is available at https://github.com/XiaoyiYuan/vaccination_online_discussion) to categorize each user’s
vaccination stance. By exploring a combination of opinion groups and retweet networks we discovered that pro- and anti-vaccine users retweet predominantly from their own opinion group, while users with neutral opinions are distributed across communities. In addition, our bot analysis (using the open-source DeBot detection platform) discovered that 1.45% of the corpus users were identified as likely bots and these produced 4.59% of all tweets within our data set. If you wish to find out more about our paper, below you can read the abstract along with seeing some figures including a sketch of our methodology, a selection of results and a link to the paper.
Abstract:
Many states in the United States allow a “belief exemption” for measles, mumps, and rubella (MMR) vaccines. People’s opinion on whether or not to take the vaccine can have direct consequences in public health. Social media has been one of the dominant communication channels for people to express their opinions of vaccination. Despite governmental organizations’ efforts of disseminating information of vaccination benefits, anti-vaccine sentiment is still gaining momentum. Studies have shown that bots on social media (i.e., social bots) can influence opinion trends by posting a substantial number of automated messages. The research presented here investigates the communication patterns of anti- and pro-vaccine users and the role of bots in Twitter by studying a retweet network related to MMR vaccine after the 2015 California Disneyland measles outbreak. We first classified the users into anti-vaccination, neutral to vaccination, and pro-vaccination groups using supervised machine learning. We discovered that pro- and anti-vaccine users retweet predominantly from their own opinion group. In addition, our bot analysis discovers that 1.45% of the corpus users were identified as likely bots which produced 4.59% of all tweets within our dataset. We further found that bots display hyper-social tendencies by initiating retweets at higher frequencies with users within the same opinion group. The article concludes that highly clustered anti-vaccine Twitter users make it difficult for health organizations to penetrate and counter opinionated information while social bots may be deepening this trend. We believe that these findings can be useful in developing strategies for health communication of vaccination.
Keywords: Anti-vaccine Movement, Twitter, Social Media, Opinion Classification, Bot Analysis
Full Reference:
Yuan, X., Schuchard, R. and Crooks, A.T. (2019), Examining Emergent Communities and Detecting Social Bots within the Polarized Online Vaccination Debate in Twitter, Social Media + Society. https://doi.org/10.1177/2056305119865465 (pdf)
In the paper entitled "Development of a Hybrid Machine Learning Agent Based Model for Optimization and Interpretability" we discuss the growth of ML within agent-based models and present the design of the hybrid agent-based/ML model called the Learning-Driven Actor-Interpreter Representation (LAISR) Model. LAISR's attempts to: "a) generate an optimal decision-making strategy through its training process, including a more constrained parameter space, and b) describe its behaviors in a human-readable and interpretable approach." To demonstrate the LAISR's model we use a simple wargaming example, that of a tactical air and ground warfare as an experiment and discuss areas of further research and applications.
If this is of interest to you, below we provide the abstract to the paper, along with a high level overview of the LAISR's model, its tactical experiment diagram and some results from the wargaming experiment. This is followed by a short movie of a representative model run that Paul has created. Finally at the the bottom of the post you can see the full reference and a link to the paper itself.
Abstract.
The use of agent-based models (ABMs) has become more wide-spread over the last two decades allowing researchers to explore complex systems composed of heterogeneous and locally interacting entities. How-ever, there are several challenges that the agent-based modeling community face. These relate to developing accurate measurements, minimizing a large complex parameter space and developing parsimonious yet accurate models. Machine Learning (ML), specifically deep reinforcement learning has the potential to generate new ways to explore complex models, which can enhance traditional computational paradigms such as agent-based modeling. Recently, ML algorithms have proved an important contribution to the de-termination of semi-optimal agent behavior strategies in complex environments. What is less clear is how these advances can be used to enhance existing ABMs. This paper presents Learning-based Actor-Interpreter State Representation (LAISR), a research effort that is designed to bridge ML agents with more traditional ABMs in order to generate semi-optimal multi-agent learning strategies. The resultant model, explored within a tactical game scenario, lies at the intersection of human and automated model design. The model can be decomposed into a format that automates aspects of the agent creation process, producing a resultant agent that creates its own optimal strategy and is interpretable to the designer. Our paper, therefore, acts as a bridge between traditional agent-based modeling and machine learning practices, designed purposefully to enhance the inclusion of ML-based agents in the agent-based modeling community.
LAISR tactical experiment diagram (A). Actor finite state machine (B).
Heat map representations of actor agents.
Full Reference:
Cummings, P. and Crooks, A.T. (2020), Development of a Hybrid Machine Learning Agent Based Model for Optimization and Interpretability, in Thomson, R., Bisgin, H., Dancy, C., Hyder, A. and Hussain, M. (eds), 2020
International Conference on Social Computing, Behavioral-Cultural
Modeling and Prediction and Behavior Representation in Modeling and
Simulation, Washington DC., pp 151-160. (pdf)
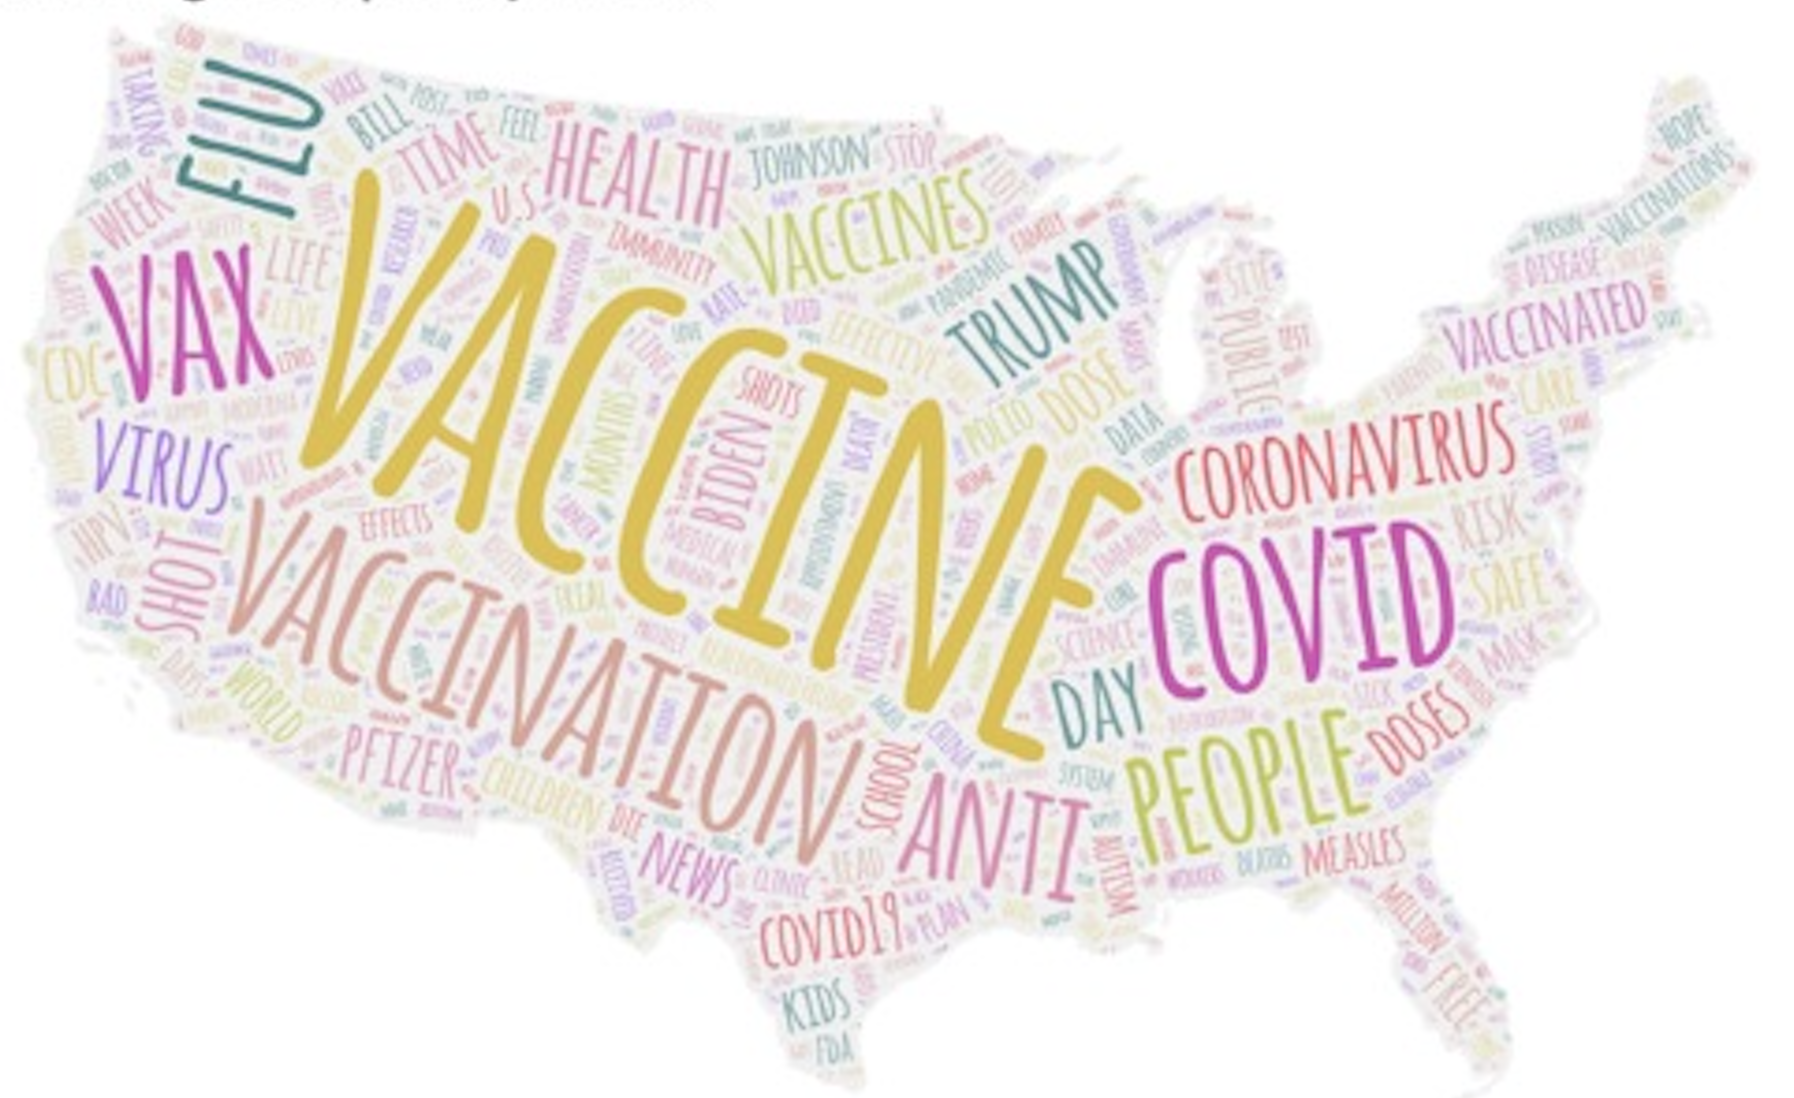
By using machine learning models (e.g., Naive Bayes, support vector machine (SVM), logistic regression, and extreme gradient boosting (XGBoost)) on over 11.7 million Twitter messages sent by approximately 2.6 million distinct users we found that while the COVID-19, it has come to dominate the vaccination discussion, there was an apparent discrepancy between the online debates and the actual vaccination rates in the US.
If this sounds of interest and you wish to find out more, below we provide the abstract to to the paper, some figures which captures our workflow and a sample of the results such as a comparison between different vaccine discussions on Twitter and the actual vaccination rate. Finally at the bottom of the page you can find the full reference and a link to the paper.
Abstract:
The recent COVID-19 pandemic has brought the debate around vaccinations to the forefront of public discussion. In this discussion, various social media platforms have a key role. While this has long been recognized, the way by which the public assigns attention to such topics remains largely unknown. Furthermore, the question of whether there is a discrepancy between people's opinions as expressed online and their actual decision to vaccinate remains open. To shed light on this issue, in this paper we examine the dynamics of online debates among four prominent vaccines (i.e., COVID-19, Influenza, MMR, and HPV) through the lens of public attention as captured on Twitter in the United States from 2015 to 2021. We then compare this to actual vaccination rates from governmental reports, which we argue serve as a proxy for real-world vaccination behaviors. Our results demonstrate that since the outbreak of COVID-19, it has come to dominate the vaccination discussion, which has led to a redistribution of attention from the other three vaccination themes. The results also show an apparent discrepancy between the online debates and the actual vaccination rates. These findings are in line with existing theories, that of agenda-setting and zero-sum theory. Furthermore, our approach could be extended to assess the public's attention toward other health-related issues, and provide a basis for quantifying the effectiveness of health promotion policies.
Keywords: COVID-19, Influenza, MMR, HPV, Social media, Vaccination.
The workflow for comparing between online social media discussion and vaccination rates.
The quarterly distribution of percentage of users by different vaccine discussion from 2015 to 2021.
The comparison between different vaccine discussions on Twitter and growth rate of the actual vaccination rate collected from the CDC (a) COVID-19; (b) Influenza; (c) HPV; (d) MMR.
The changes of emotion over time for different vaccines.
Full reference:
Chen Q, Croitoru A. and Crooks A.T (2023), A Comparison between Online Social Media Discussions and Vaccination Rates: A tale of four vaccines. DIGITAL HEALTH: 9. doi:10.1177/20552076231155682. (pdf)
At this years Association of American Geographers (AAG) Annual Meeting we have a number of presentations ranging from how one can leverage newspaper articles to study cities over time, to that of how people may chose to become vaccinated. These presentations build on the great work of students and postdocs here at the University at Buffalo and link to our interests in urban analytics, machine learning and agent-based modeling. Below we just give a glimpse at these topics (along with their abstracts) and if you are interested in finding out more please reach out to us.
Natural disasters, such as earthquakes, floods, and wildfires, have been a long-standing concern to societies at large. With growing attention being paid to sustainable and resilient communities, such concern has been brought to the forefront of resilience studies. However, the definition of disaster resilience is intricate and can vary across the diverse disciplines that study them (e.g., geography, sociology and political science), making its definition and quantification elusive. Moreover, the vast majority of studies often focus on the immediate response to an event, not the long-term recovery of the area impacted by disasters. Thus to date investigating the resilience of an area or a society over a prolonged period of time has remained largely unexplored. To overcome these issues, we propose a novel approach from a social perspective utilizing network analysis and concepts from disaster science (e.g., the resilience triangle) to quantify the long-term impacts of wildfires, especially on collective human behavior. Taking the Camp and Mendocino Complex wildfires - the most deadly and the largest complex wildfires in California to date, respectively - as case studies, we capture the features of resilience, such as robustness and vulnerability, of communities based on human mobility data from 2018 to 2020. The results show that demographic and socioeconomic characteristics alone only partially capture community resilience, however, by leveraging human mobility data and network analysis techniques, we can enhance our understanding of resilience over space and time, which can provide a new lens to study natural disasters and their long-term impacts on society.
Keywords: Community Resilience, Natural Disasters, Wildfires, Social Network Analysis, Human Mobility, Space and Time.
Full Reference
Chen, Q., Wang, B. and Crooks, A.T. (2023), Community Resilience to Wildfires: A Network Analysis Approach Utilizing Human Mobility Data, The Association of American Geographers (AAG) Annual Meeting, 23rd –27th March, Denver, CO. (pdf)
Today we are awash with data especially when it comes to studying cities from a diverse data ecosystem ranging from demographic to that of remotely sensed imagery and social media. This has led to the growth of geographical data science and urban analytics providing new ways to conduct quantitative research within cities. One area that has seen significant growth is that of using natural language processing techniques on text data from social media to explore various issues relating to urban morphology. However, social media only provides limited insights when dealing with longer-term urban phenomena, such as the growth and shrinkage of cities. This relates to the fact that social media is a relatively recent phenomenon compared to more longer-term urban problems that take decades to emerge. With respect to the longer-term coverage, newspapers which are increasingly becoming digitized provide the possibility to overcome the limitations of social media and provide insights over a timeframe that social media does not. To demonstrate the utilization of newspapers within urban analytics and to study longer-term urban issues, we present an advanced topic modeling technique (i.e., Bertopic) on a large number of newspaper articles spanning the years 1975 to 2021 to explore urban shrinkage in Detroit. Our topic modeling results reveal the insights related to Detroit's shrinkage can be linked to the side effects of economic recessions on Detroit's automobile industry, local employment status, and the housing market. As such, this work demonstrates the potential of utilizing newspaper articles to study long-term issues
Keywords: Natural Language Processing, Topic Modeling, Newspapers, Text Data, Urban Shrinkage, Urban Analytics.
Full Reference
Jiang, N., and Crooks A.T. (2023), Leveraging Newspapers to Understand Urban Issues: A Longitudinal Analysis of Urban Shrinkage in Detroit, The Association of American Geographers (AAG) Annual Meeting, 23rd –27th March, Denver, CO. (pdf)
Switching gears slightly, we have another presentation that leverages text data, in this case Yelp reviews to help inform decision making within an agent-based model. This presentation with Boyu Wang is entitled "Do people care about others' opinions of places? Utilizing crowdsourced data and deep learning to model peoples’ review patterns." We use a geospatial artificial intelligence (GeoAI) technique called aspect-based sentiment analysis to extract and categorize reviewers' opinion aspects on places within urban areas and then use this information to inform an agent-based model of peoples choices to which restaurants to go to.
Abstract
People's opinions are one of the defining factors that turn spaces into meaningful places. While these opinions are subject to individual differences, they can also be influenced by the opinions from others. Online platforms such as Yelp allow users to publish their reviews on businesses. To understand reviewers' opinion formation processes and the emergent patterns of published opinions, we utilize geospatial artificial intelligence (GeoAI) techniques especially that of aspect-based sentiment analysis methods (a deep learning approach) on a geographically explicit Yelp dataset to extract and categorize reviewers' opinion aspects on places within urban areas. Such data is then used as a basis to inform an agent-based model, where reviewers' (i.e., agents') opinions are characterized by opinion dynamics. The parameters of these models are calibrated using extracted opinion aspects from the Yelp dataset. Such a method moves opinion dynamics models away from theoretical concepts to a more data-driven approach, with a specific emphasis being made on place. Focusing on 10 US metropolitan areas which are spread out across the country, we examine the calibrated influence coefficients for each opinion aspect category (e.g., location, experience, service), to compare reviewers' opinion formation processes across different categories. The results show the emergent patterns of reviewers' opinions and the influence of these opinions on others. As such this work demonstrates how using deep learning techniques on geospatial data can help advance our understanding of place and cities more generally.
Wang, B. and Crooks, A.T. (2023),
Do People Care About Others' Opinions of Places? Utilizing Crowdsourced
Data and Deep Learning to Model Peoples’ Review Patterns, The Association of American Geographers (AAG) Annual Meeting, 23rd –27th March, Denver, CO. (pdf)
With the advent of information and communication technologies, human dynamics studied in a purely physical space increasingly shift to a cyber and relational context. While researchers increasingly recognize the shift and call for attention to the multi-dimensionality of human dynamics (e.g., Splatial framework). Rarely have studies investigated how the information propagated in hybrid spaces affects people’s decision-making process, such as Covid-19 vaccine uptake. Meanwhile, compared to the urban population, the rural population faces greater digital barriers and has been further left out in human dynamics research. To fill this gap, our study investigates Covid-19 vaccine uptake in a rural county (i.e., Chautauqua) in New York State through agent-based modeling. We first generated a synthetic population to match the demographic characteristics of the census data. Then we created home, work, school, and social media networks to represent hybrid spaces. We defined the opinion dynamics of agents based on the social influence network theory. Next, we calibrated and validated our agent-based model based on real-world vaccine update records. Our research helps to elucidate the information propagation mechanism in hybrid spaces and clarify the decision-making process in the digital age. Furthermore, our method can also shed light on how to overcome data limitations for under-represented populations such as those who live in rural areas.
Yin, F., Crooks, A.T. and Yin,
L. (2023), How Information Propagation in Physical, Relational and Cyber
Spaces Affects Covid-19 Vaccine Uptake: Evidence from Rural County, The Association of American Geographers (AAG) Annual Meeting, 23rd –27th March, Denver, CO. (pdf)
The Department of Geography at the University at Buffalo (UB)
invites applicants for a postdoctoral researcher position with broad
interests in urban analytics with a particular emphasis on modeling and
simulation.
The postdoctoral researcher will be expected develop
systems to collect and store social media data and use such data to
inform and develop a portfolio of innovative agent-based models
utilizing machine learning methods to study urban areas. The ideal
candidate will have experience with developing agent-based models,
social network analysis, GIS and machine learning.
Key responsibilities:
Collecting, storing and analyzing social media data for a variety of urban topics.
Working at UB comes with benefits that exceed salary alone.
There are personal rewards including comprehensive health and retirement
plan options. We also focus on creating and sustaining a healthy mix of
work, personal and academic pursuit – all in an effort to support your
work-life effectiveness. Visit our benefits website to learn about our benefit packages.
About UB
The University at Buffalo is SUNY’s most comprehensive public
research university, and an outstanding place to work. UB amplifies
ambition for faculty and staff by offering endless possibilities to
achieve more. Here, people from all backgrounds and cultures challenge
and inspire each other to discover, learn and succeed. Dedicated staff
and engaged faculty collaborate to further knowledge and understanding,
and develop tenacious graduates who are valued for their talents and
their impact on global society. Visit our website to learn more about
the University at Buffalo.
As an Equal Opportunity / Affirmative Action employer, the
Research Foundation will not discriminate in its employment practices
due to an applicant’s race, color, religion, sex, sexual orientation,
gender identity, national origin and veteran or disability status.
In the past we have written about how vaccination is discussed on social media but such studies were often just focused on short study periods (i.e. a month). However, with the current COVID-19 pandemic we thought we would revisit the vaccination debate and see if it has changed. So in a new paper with Qingqing Chen entitled "Analyzing the vaccination debate in social media data Pre- and Post-COVID-19 pandemic," we did just that. We explored approximately 11.7
million tweets posted between January 2015 to July 2021 and measured and mapped
vaccine sentiments (Pro-vaccine, Anti-vaccine, and Neutral) across the US. Not to ruin the surprise of what we found but also to encourage you to read the paper we will not write about the results here. Only show the abstract of the paper, a few of the figures and a link to the paper itself.
Abstract
The COVID-19 virus has caused and continues to cause unprecedented
impacts on the life trajectories of millions of people globally.
Recently, to combat the transmission of the virus, vaccination campaigns
around the world have become prevalent. However, while many see such
campaigns as positive (e.g., protecting lives), others see them as
negative (e.g., the side effects that are not fully understood
scientifically), resulting in diverse sentiments towards vaccination
campaigns. In addition, the diverse sentiments have seldom been
systematically quantified let alone their dynamic changes over space and
time. To shed light on this issue, we propose an approach to analyze
vaccine sentiments in space and time by using supervised machine
learning combined with word embedding techniques. Taking the United
States as a test case, we utilize a Twitter dataset (approximately 11.7
million tweets) from January 2015 to July 2021 and measure and map
vaccine sentiments (Pro-vaccine, Anti-vaccine, and Neutral) across the
nation. In doing so, we can capture the heterogeneous public opinions
within social media discussions regarding vaccination among states.
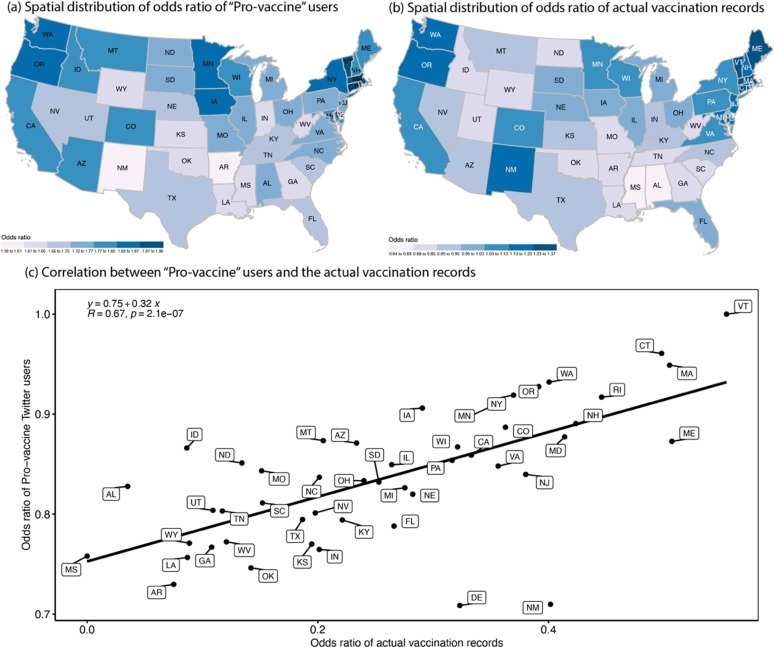
Results show how positive sentiment in social media has a strong
correlation with the actual vaccinated population. Furthermore, we
introduce a simple ratio between Anti and Pro-vaccine as a proxy to
quantify vaccine hesitancy and show how our results align with other
traditional survey approaches. The proposed approach illustrates the
potential to monitor the dynamics of vaccine opinion distribution
online, which we hope, can be helpful to explain vaccination rates for
the ongoing COVID-19 pandemic.
Keywords: COVID-19, Pandemic, Vaccination Sentiment Analysis, Time and Space, Social Media, United States.
Overview of our research pipeline.
Comparison between Twitter data and Google Trends. (a) Distribution of keywords search and tweets over time; (b) Correlation between Google Trends and Twitter data of keywords search; (c) Important news or announcements catched on Twitter activity (Note: period is the shaded area in (a)).
Correlation between Pro-vaccine users and actual vaccination records (a) Spatial distribution of odds ratio of Pro-vaccine users; (b) Spatial distribution of odds ratio of actual vaccination records; (c) Correlation between the Pro-vaccine users and the actual vaccination records.
Full Reference:
Chen, Q. and Crooks, A.T. (2022), Analyzing the Vaccination Debate in Social Media Data Pre- and Post-COVID-19 Pandemic, International Journal of Applied Earth Observation and Geoinformation, 110: 102783. Available at https://doi.org/10.1016/j.jag.2022.102783 (pdf)
As the AAG has just wrapped up I thought I would write brief (well actually quite long) post on the talks that I was involved with at the conference. These talks would not have been possible without the many great students and colleagues who I have been collaborating with over time. Below you will find a brief summary of the talks and if any sound interesting, please reach out and we can give you more details.
First up (in order in which they were presented) was "Utilizing Streetview Images for Mapping Building Attributes with ChatGPT" with Qingqing Chen and Linda See. In this talk we discussed how multimodal Large Language Models are giving us a new way to study cities, in the sense, lowering the boundary for information extraction. Using ChatGPT andstreet view images from Mapillary as an example, we showed how one can extract building age, usage (e.g., commercial, mixed use, residential) and estimate building height which could all be used to inform urban climate models which require detailed information on buildings.
Abstract:
With increasing rates of urbanization, many challenges are emerging regarding sustainability such as the energy usage of buildings. Coinciding with this is the growing attention of urban climate models for energy demand estimation and climate adaptation strategies. However, the applicability of these models is constrained by the lack of detailed urban surface information. Therefore, creating comprehensive datasets that capture urban surface information at a granular scale is crucial for responding to our rapidly urbanizing world. Recent advancements in Large Language Models (LLMs) have opened new opportunities in urban studies, offering accessible methods for information extraction. In this talk we explore the feasibility of ChatGPT to extract building attributes from images. Taking New York City as a case study, we collect building images from Mapillary and process them through ChatGPT by posing specific questions to extract building attributes (e.g., height, functions, age). These attributes are then compared with authoritative data. The proposed method helps address the current dearth of fine-grained surface data on urban issues, therefore enhancing the accuracy and utility of urban climate models. Overall, this study demonstrates the practical applications of ChatGPT in geographic knowledge extraction, advancing the understanding of LLMs in geographic contexts, and more broadly to the discourse on Artificial Intelligence (AI) in urban modeling and climate science.
Keywords: Buildings, ChatGPT, Large Language Models (LLMs), Mapillary, Street View Images (SVI), GeoAI.
Example of Workflow.
Reference:
Chen, Q., See, L. and Crooks, A.T. (2025), Utilizing Streetview Images for Mapping Building Attributes with ChatGPT, The Association of American Geographers (AAG) Annual Meeting, 24th –28th March, Detroit, MI. (pdf)
This was followed by a talk by lead by Qingqing Chen entitled "Multi-sensory Experiences: The Connection Between the Smell and Vision in Understanding Urban Environments" where we explored to what extent can visual data from street view imagery be used as a proxy for capturing large-scale urban smell perceptions when compared to geosocial media. Such as what visual cues evoke specific smell perceptions.
Abstract:
Smell is a crucial transversal sense, which bridges the tangible aspects of urban environments, such as exhaust and garbage, with their intangible impacts on emotions, social interactions and well-being. Despite its crucial role in our everyday life, many urban studies primarily focus on the visual dimension, potentially introducing biases in our understanding of urban spaces. This research transcends this visual-centric bias by integrating the olfactory perceptions to investigate the nuanced relationship between smell and vision in urban environments. Specifically, we utilize advanced semantic segmentation to extract visual elements from street view imagery (i.e., Mapillay) and apply casual forest analysis to examine their causal effects on smell expectations recorded from human participants. These expectations, often tied to personal experiences and/or cultural associations, are compared with real-environment smell experiences derived from geosocial media (i.e., Twitter/X). The results show that visual cues can predict smells in straightforward urban settings, such as small parks or less densely populated areas. However, in complex urban environments, the predictive power of visual cues diminishes as diverse and overlapping scents obscure specific smells, even in visually distinct areas. These findings underscore the importance of a multisensory approach in urban studies, enhancing our understanding of the complex interplay between sensory experiences and informing urban design strategies that integrate multiple senses to create more engaging and inclusive environments. This is especially important for individuals with sensory impairments, such as anosmia or visual impairments, who rely on other senses to compensate for their perception of urban environments.
Keywords: Multi-sensory Experiences, Smell and Vision; Semantic Segmentation, Causal Effects, Geosocial Media, Street View Imagery (SVI).
Workflow
Reference:
Chen, Q. and Crooks, A.T. (2025), Multi-sensory Experiences: The Connection Between the Smell and Vision in Understanding Urban Environments, The Association of American Geographers (AAG) Annual Meeting, 24th –28th March, Detroit, MI. (pdf)
In the Geosimulation session that we organized, we had a talk entitled "Large Language Models for Conceptualizing, Designing, and Generating Agent-based Models" where Na Jiang, Boyu Wang and myself presented our work on exploring using multimodal Large Language Models (LLMs) to create age-based models. In the sense as modelers, we spend a lot of time developing and writing code and we were curious what could be done though the use of LLMs.
To give a sense of what is possible, below is an example of using ChatGPT for creating a model from a published paper.
Abstract:
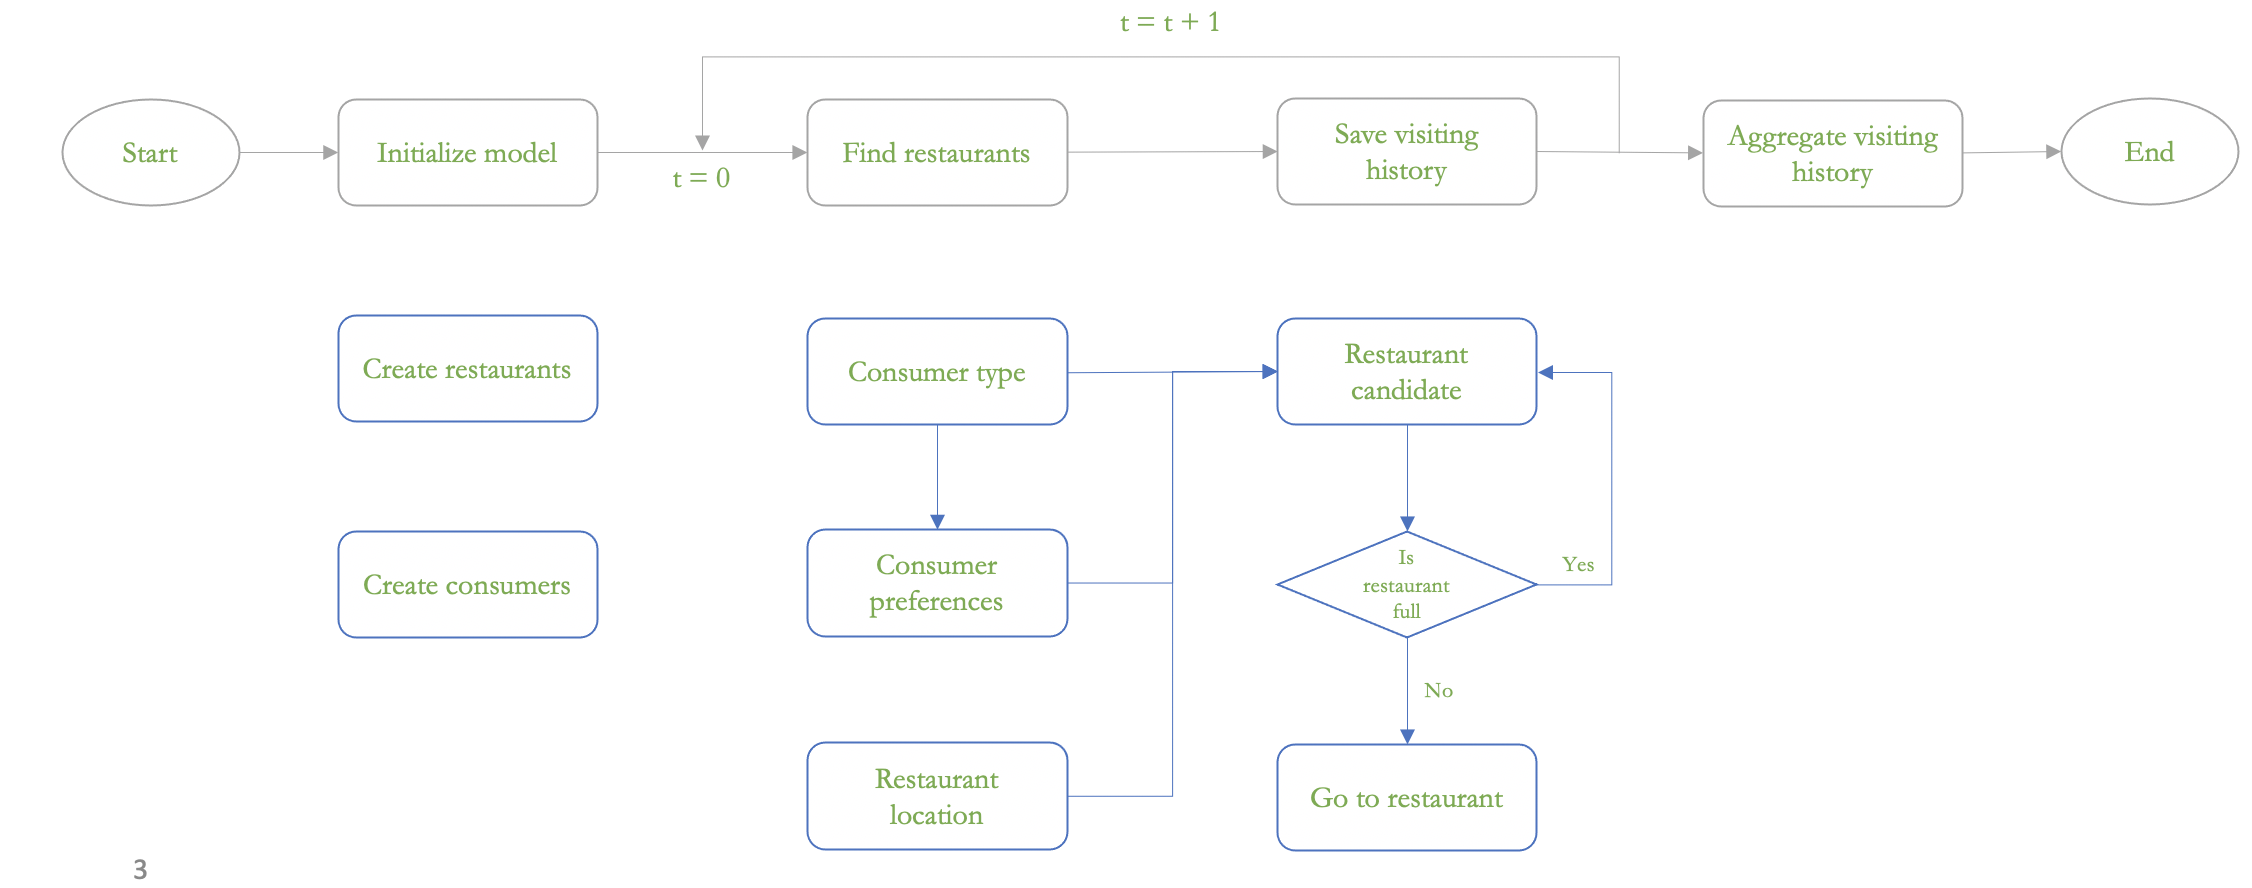
Large language models (LLMs) play an important role in AI-powered code assistants such as code completion, debugging, and documentation. Such models can be further fine-tuned on smaller amount of data for specific tasks, often with the improvement of performance compared to generic LLMs. However, such fine-tuning techniques are seldomly used in generating sophisticated agent-based models (ABMs), because they are often implemented as software that demands extra standards such as the “Overview, Design concepts, and Details” (ODD) protocol. This research examines how we can bridge this gap by utilizing LLMs in designing or conceptualizing, building, and running agent-based models in the form of user prompts. . In this work, two models are created to demonstrate the proposed method. Specifically, Sakoda’s checkerboard model of social interaction is created by LLM from explicit design and description through prompts. The other model stimulates consumer preferences and restaurant visits as designed and implemented by a LLM. These models are evaluated by human experts on their code correctness and quality for both verification and validation purposes. This work serves as a first step towards fine-tuned LLMs on existing models and documentations to create high-quality and functional ABMs based on either user prompts or standard protocols, contributing to further exploration on the future of AI-assisted geospatial simulation development.
Keywords: Agent-Based Modeling, Large Language Models, Geospatial Simulation
Reference:
Jiang, N., Wang, B. and Crooks, A.T. (2025), Large Language Models for Conceptualizing, Designing, and Generating Agent-based Models, The Association of American Geographers (AAG) Annual Meeting, 24th –28th March, Detroit, MI. (pdf)
Next up was Ying Zhou who presented our work entitled "Identifying Environmental Characteristics That Influence Perceived Safety in Urban Spaces." In this work we explored how using social media data can be used to study the fear and how this relates to actual crimes within New York city. Broadly speaking we find through our analysis, that fear sentiment may spread out between the neighborhoods and their surrounding areas and that neighborhoods surrounded by crime-clusters may have high sentiments of fear.
Abstract:
One goal of creating livable cities is to enhance health and safety. While previous research in spatial analysis and urban planning has focused on correlations between physical environments and crime, typically relying on police-reported crime data from sources like the Crime Open Database (CODE), safety perception is inherently subjective and cannot be fully represented by objective crime statistics alone. Also, urban planning today has gradually shifted its focus from a top-down mechanism to a bottom-up mechanism, so understanding and fostering spaces where residents feel safe is essential. This research examines factors that contribute to residents’ perceived insecurity in New York City. In addition to spatial analysis of the open crime data, the research used social media data to acquire people’s perceptions. The result indicates that the aggregations of perceived unsafe locations overlapped with aggregations of crime data's locations, such as in Manhattan’s neighborhoods, but they do not overlap with each other entirely. By adopting Latent Dirichlet Allocation (LDA), a method of topic modeling, the research filtered and summarized the posted texts and contents related to the negative descriptions of places or spaces in the city, and then it identified the related characteristics of the environments. The characteristics are investigated by the method of local Moran’s I, which indicates their spatial autocorrelation in some neighborhoods in the city of New York. This research offers “bottom’s views” about urban safety for both urban planning and decision-makers, which contributes to people-centered consideration for future development and urban resource distribution.
Zhou, Y. and Crooks, A.T. (2025), Identifying Environmental Characteristics That Influence Perceived Safety in Urban Spaces, The Association of American Geographers (AAG) Annual Meeting, 24th –28th March, Detroit, MI. (pdf)
The last day of the conference was another busy day with two talks. First was entitled "PySGN: A Python Package for Constructing Synthetic Geo-social Networks" where Boyu Wang presented our work (with Taylor Anderson and Andreas Züfle) on a Python package that can be used to generate synthetic geo-social networks. As readers of this blog might know we have a an interest in social networks and using them in modeling and this package provides a toolkit for others to easily create their own geosocial networks (e.g., Geospatial Erdős-Rényi, Barabási–Albert and Watts-Strogatz models). For interested readers, the source code available at: https://github.com/wang-boyu/pysgn.
Abstract:
Synthetic population has been widely used in social simulations such as traffic modeling, pedestrian movements, and the spread of infectious diseases. In recent years, much attention was focused on generating synthetic population with social networks, that captures social connections between individuals. While synthetic populations are often geographically explicit, various algorithms have been proposed to create realistic geographic social (geo-social) networks, aiming to integrate spatial information into people’s social links. We build an open-source Python package, namely PySGN, for constructing synthetic geo-social networks that incorporates position information, exhibits small-world network properties, and can be scaled to hundreds of thousands and potentially millions of nodes. We discuss different ways of parametrizing the method, by either a global average node degree, or an expected degree for each individual node. It is demonstrated through a case study with synthetic population in Buffalo, NY. By doing so, we aim to illustrate how such synthetic geo-social networks can be created, utilized, and analyzed in downstream agent-based modeling and network analysis tasks. This work is available as an open-source Python package and integrated with the PyData ecosystem (e.g., GeoPandas, NetworkX), and can be further extended with more synthetic geo-social network algorithms in the future.
Wang, B., Crooks, A.T., Anderson, T. and Züfle, A. (2025), PySGN: A Python Package for Constructing Synthetic Geo-social Networks. The Association of American Geographers (AAG) Annual Meeting, 24th –28th March, Detroit, MI. (pdf)
The final talk (well for me) was presented by Fuzin Yin who presented our work with Lucie Laurian and Emmanuel Frimpong Boamah entitled "Analysis of Online Mutual Aid Network during Buffalo Blizzard 2022: Actors and Weak Ties." In this work we explored what kind of support was offered and requested over Facebook groups along with their network structures durring and shortly after the event utilizing machine learning.
Abstract:
In December 2022, Buffalo, NY encountered a once-in-a-generation blizzard that dropped over 4 feet of snow. This four-day snow event halted emergency services and left 47 dead. In the face of the devastating blizzard, Buffalonian demonstrated resilience and solidarity by establishing Facebook (FB) groups to share information and coordinate behaviors including donations, wellness checks, and snow removals. These spontaneous behaviors created an essential layer of protection when the major infrastructure was down. This research has collected data from Buffalo blizzard FB groups to analyze community-led self-help behaviors. We have used machine learning to classify FB messages into four categories (e.g., requesting help, offering help, emotional support, and other), and social network analysis to explore users’ communication patterns. Results show that out of all messages (n=9,988), 37% of them express emotional support, which is followed by messages offering help (25%). While requests for help constitute a small proportion (8%), they stimulate more replies than other categories. Network statistics suggest that the mutual aid network is low-density but with a high clustering coefficient. This implies that most group members are strangers with weak ties, but their connections are in the right place to allow efficient communication. However, users do not equally benefit where people requesting or offering help are central in online conversation while pure emotional supporters are at the periphery. We conclude that during the Buffalo blizzard 2022, online interactions translate into offline mutual assistance by establishing weak ties among disconnected users to facilitate the flow of information and resources.
Keywords: crisis informatics, mutual aid, social network analysis, machine learning, social media
Results of Mutual Aid Network during Buffalo Blizzard 2022
Reference:
Yin, F., Laurian, L., Crooks, A.T. and Boamah, E.F. (2025), Analysis of Online Mutual Aid Network during Buffalo Blizzard 2022: Actors and Weak Ties, The Association of American Geographers (AAG) Annual Meeting, 24th –28th March, Detroit, MI. (pdf)
While this is a rather longer post than normal, we hope you found it interesting and also as noted at the top of the post, if any of these talks/topics are of interest to you please feel free to reach out.
Continuing on our work of exploring health related issues in social media, Xiaoyi Yuan and myself had a paper accepted at the 9th International Conference on Social Media and Society. In our paper entitled: "Examining Online Vaccination Discussion and Communities in Twitter" we examined the communication patterns of anti-vaccine and pro-vaccine users on Twitter by studying the retweet network from 660,892 tweets related to the measles, mumps, and rubella (MMR) vaccine published by 269,623 users using supervised learning to identify clusters of users based on their opinions (i.e. a pro-vaccine, anti-vaccine, or neutral user).
The overall methodology can be seen in Figure 1 and more details can be found in the paper. Our data was collected using the GeoSocial Gauge System, however, since tweets are short and their content diverse, the data corpus needed to be cleaned so that the tweets could then be converted to features (e.g., unigrams or bigrams). After which we were able to use such features for training a variety of classifiers (i.e., logistic regression, support vector machine (linear and non-linear
kernel), k-nearest neighbors, nearest centroid, and Naïve Bayes) to identify opinion groups. After this, we moved from on from identifying each user’s opinion to construct a retweet network in order to understand how in-group and cross-group communicate in the committees detected via retweet network. By carrying out this analysis we discovered that pro- and anti-vaccine users retweet predominantly from their own opinion group, while users with neutral opinions are distributed across communities. Below you can read our abstract, see some results from our study and the full reference (and link) to the paper.
Figure1: Steps used in our study to unveil the communication patterns of pro-vaccine and anti-vaccine users on Twitter
Abstract:
Many states in the US allow a “belief exemption” for measles, mumps, and rubella (MMR) vaccines. People’s opinion on whether or not to take the vaccine could have direct consequences in public health— once the vaccine refusal of a group within a population is higher than what herd immunity can tolerate, a disease can transmit fast causing large scale of disease outbreaks. Social media has been one of the dominant communication channels for people to express their opinions of vaccination. Despite governmental organizations’ effects of disseminating information of vaccination benefits, anti-vaccine sentiment is still gaining its momentum, especially on social media. This research investigates the communicative patterns of anti-vaccine and pro-vaccine users on Twitter by studying the retweet network from 660,892 tweets related to MMR vaccine published by 269,623 users after the 2015 California Disneyland measles outbreak. Using supervised learning, we classified the users into anti-vaccination, neutral to vaccination, and pro-vaccination groups. Using a combination of opinion groups and retweet network structural community detection, we discovered that pro- and anti-vaccine users retweet predominantly from their own opinion group, while users with neutral opinions are distributed across communities. For most cross-group communication, it was found that pro-vaccination users were retweeting anti-vaccination users than vice-versa. The paper concludes that anti-vaccine Twitter users are highly clustered and enclosed communities, and this makes it difficult for health organizations to penetrate and counter opinionated information. We believe that this finding may be useful in developing strategies for health communication of vaccination and overcome some the limits of current strategies.
Key Words: Anti-vaccine movement, Twitter, social media, opinion classification
Figure 2: Network visualizations of the four largest communities. A: is colored by the belonging to a specific structural community and; B: is colored by belonging to opinion groups
Figure 3: Distributions of opinion groups in the four largest structural community
Full Reference:
Yuan, X. and Crooks, A.T. (2018), Examining Online Vaccination Discussion and Communities in Twitter, Proceedings of the 9th International Conference on Social Media and Society, Copenhagen, Denmark, pp 197-206. (pdf)
Update: Our paper was selected as best paper at the conference.